FXEM - EMPIRE MARKETS - Company New Article
To access the website's classic version and the new accounts, please click here
Aug 19, 2025
 |
|
|
 |
||
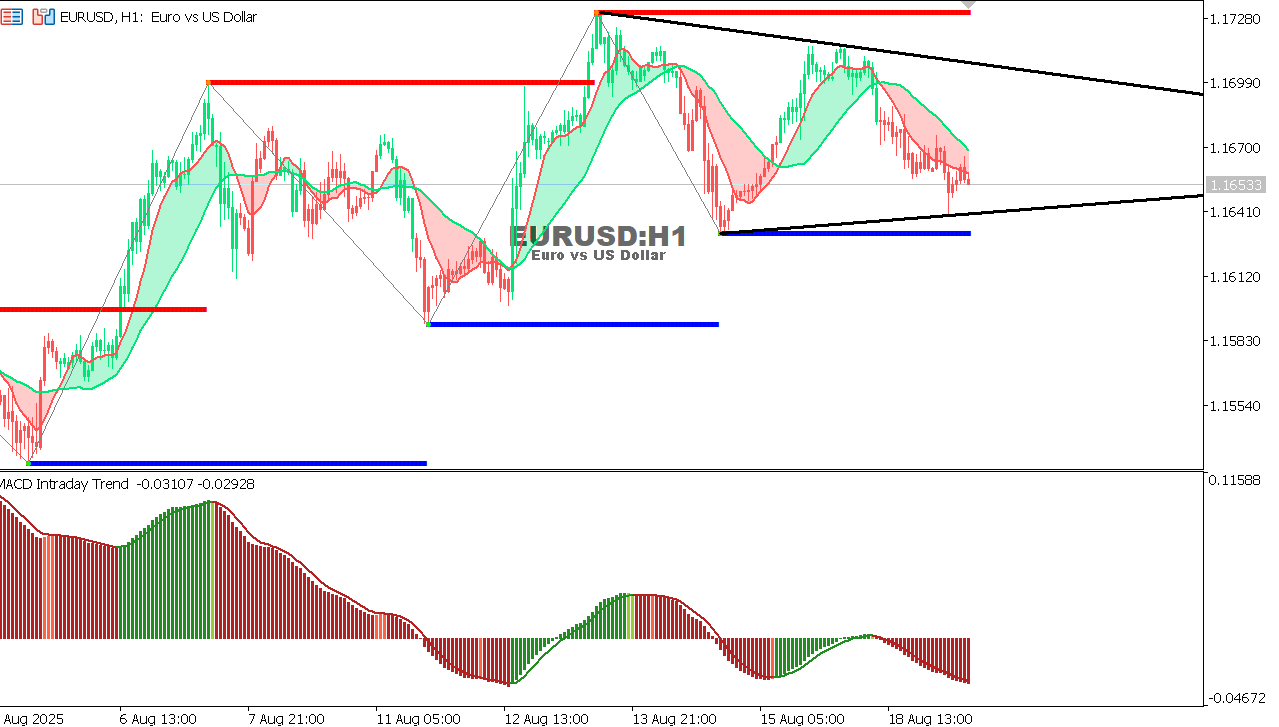
EUR/USD Chart on the hourtly time framePattern: Symmetrical Triangle Support: 1.1640 (lower blue line) Resistance: 1.1700 - 1.1728 (upper red line) Current Trend: Consolidating within triangle MACD: Bearish momentum is building Outlook: Watch for breakout. A break above 1.1728 could lead to 1.1750+. A break below 1.1640 opens downside toward 1.1600.
|