FXEM - EMPIRE MARKETS - Company New Article
To access the website's classic version and the new accounts, please click here
Aug 18, 2025
 |
|
|
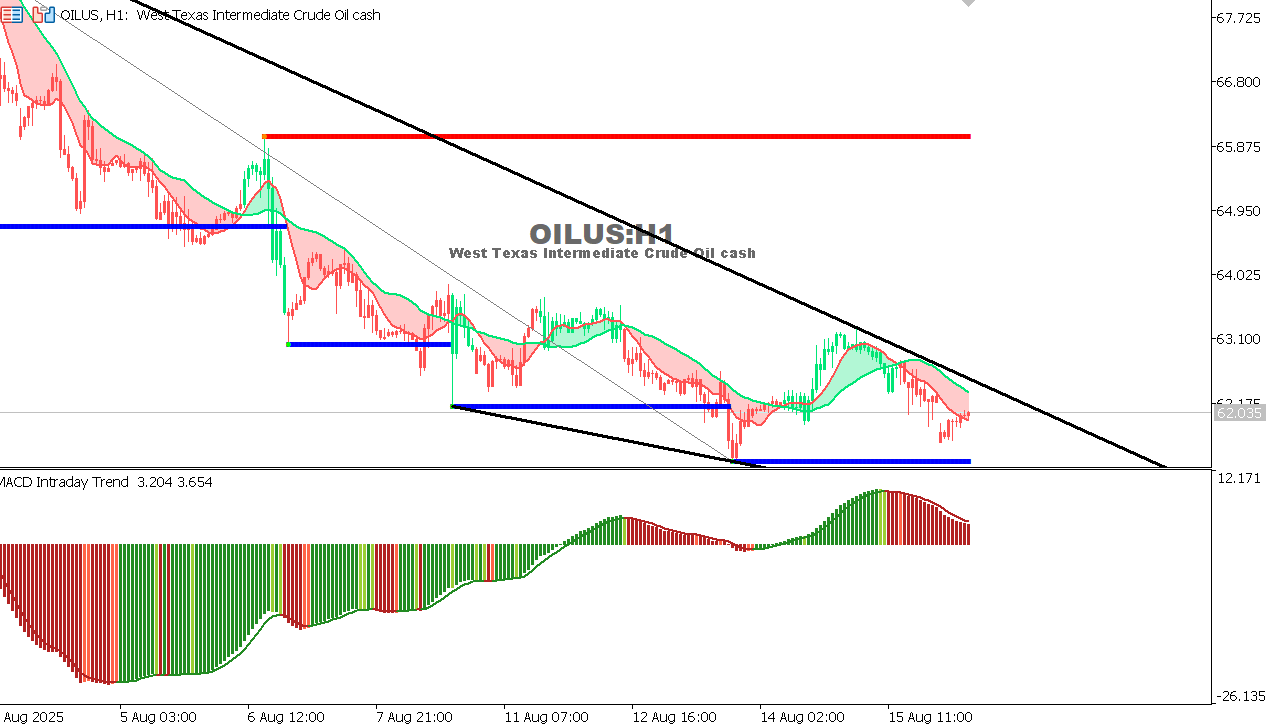 |
USOIL Chart on the hourtly time frameTechnical Indicator: The MACD shows bearish signals, indicating a possible price decline. Technical Analysis: The price is moving within a downward channel, and a break below 61.95 could lead to further declines towards lower levels. |
 |
|
|
 |
|
|