FXEM - EMPIRE MARKETS - Company New Article
To access the website's classic version and the new accounts, please click here
Aug 19, 2025
 |
|
|
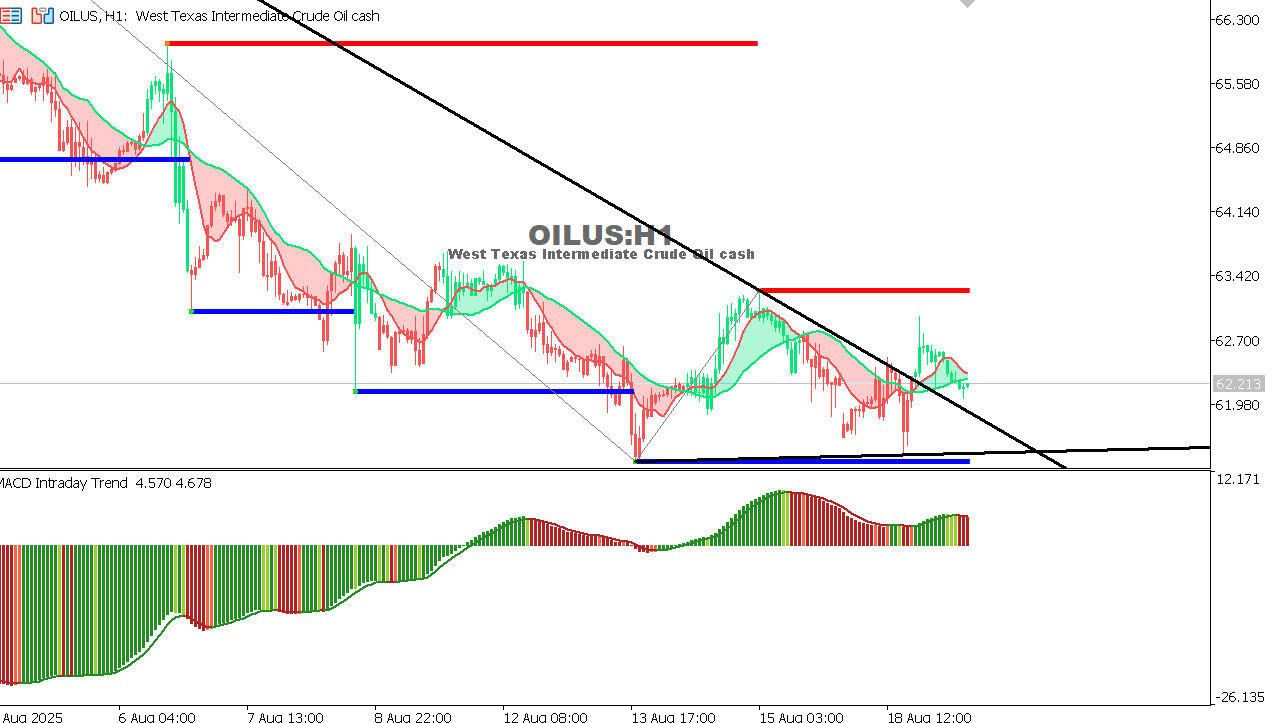 |
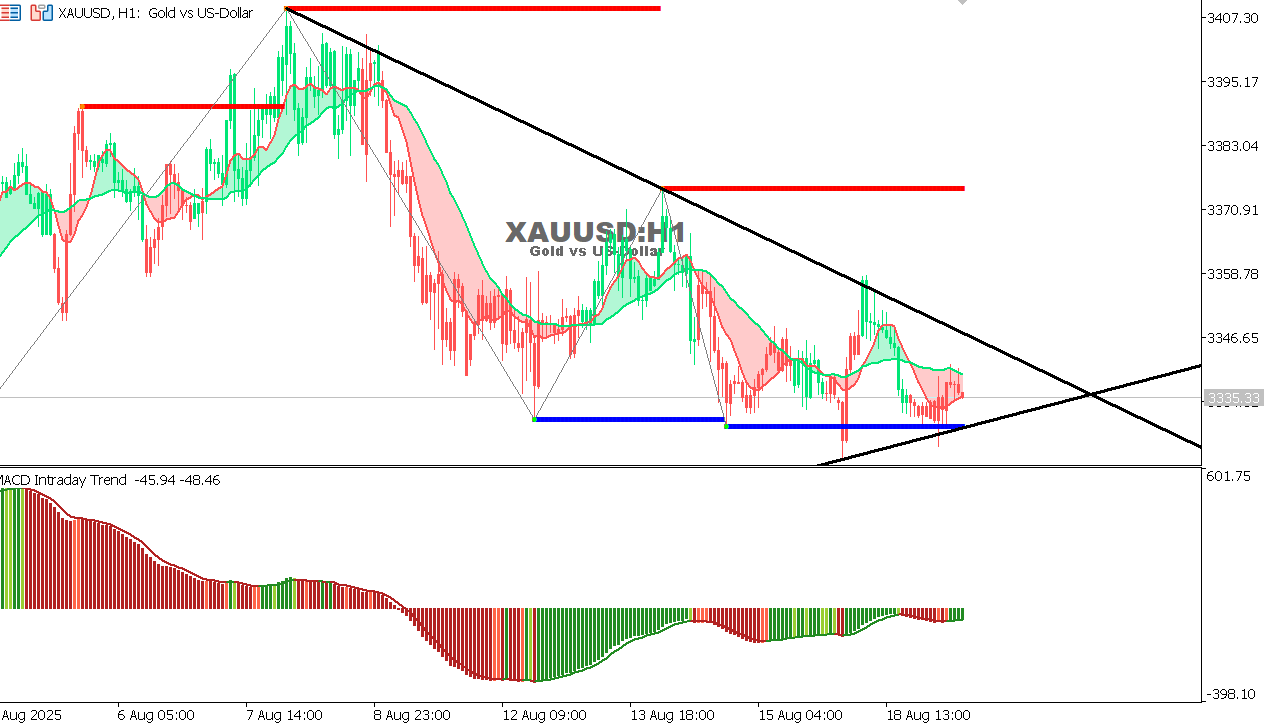
USOIL Chart on the hourtly time frameTrend: Attempting breakout from previous downtrend Support: 61.80 - 61.90 Resistance: 63.40 MACD: Turning positive Outlook: Sustained breakout above trendline suggests upside toward 63.40. Failure may see price drop back toward 61.50. |
 |
|
|
 |
|
|