FXEM - EMPIRE MARKETS - Company New Article
To access the website's classic version and the new accounts, please click here
Aug 11, 2025
 |
|
|
 |
||
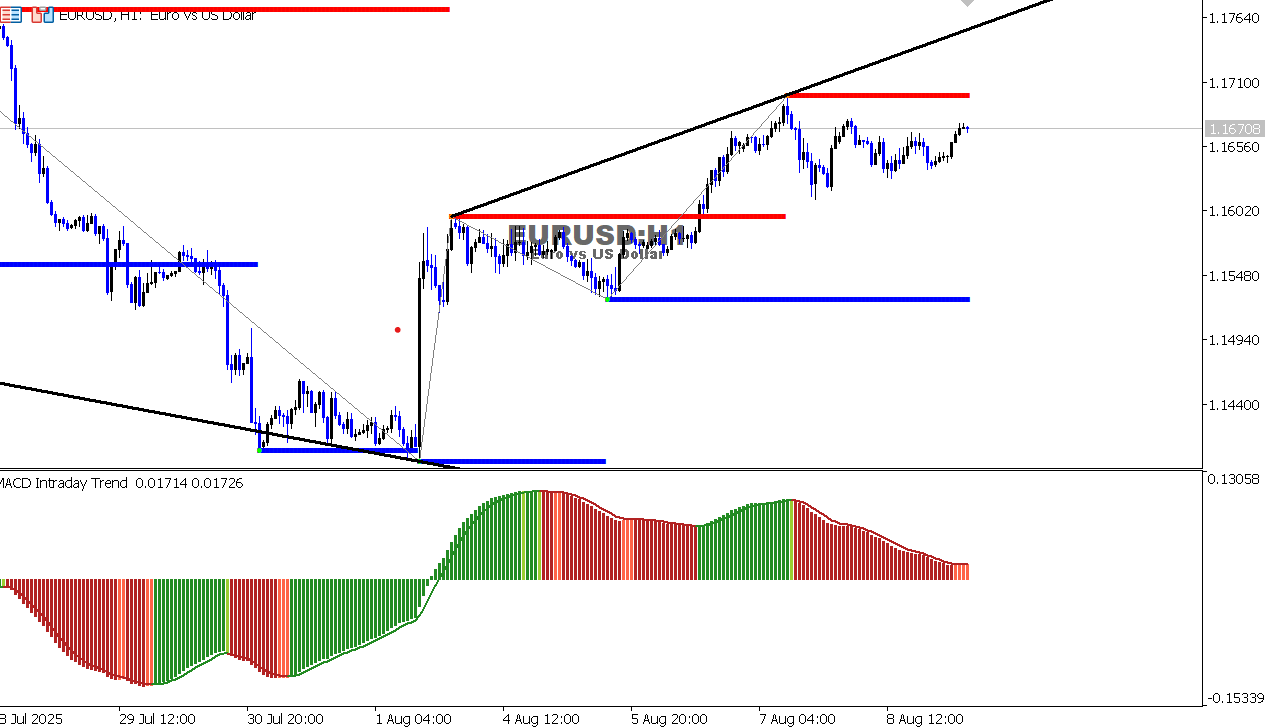
EUR/USD Chart on the hourtly time frameOverall Trend: Short-term bullish. Key Resistance: 1.1710 – not yet broken. Key Support: 1.1545 – clear support from previous lows. MACD: Showing weakening bullish momentum (fading green bars). Potential Scenario: May see a pullback if it fails to break 1.1710. A break below 1.1600 could trigger further downside.
|