FXEM - EMPIRE MARKETS - Company New Article
To access the website's classic version and the new accounts, please click here
Aug 11, 2025
 |
|
|
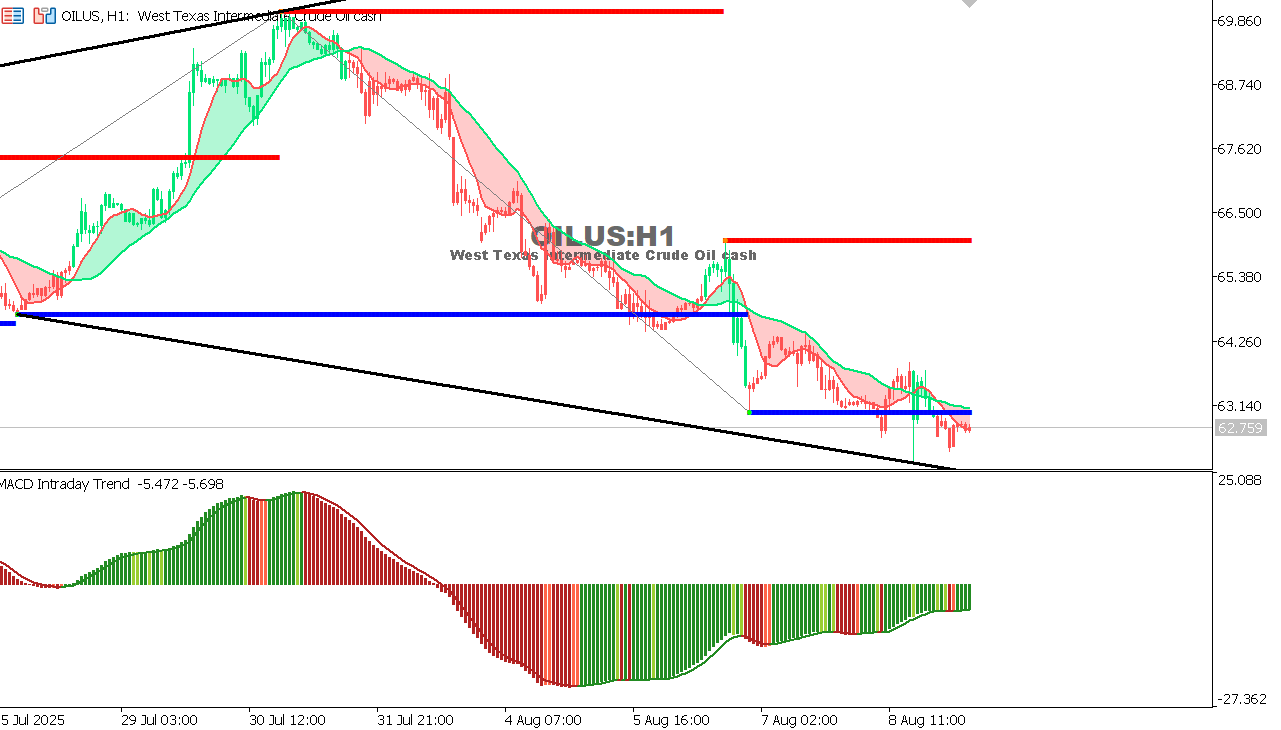 |
USOIL Chart on the hourtly time frameOverall Trend: Bearish. Support: 62.75 – critical level. Resistance: 63.90. MACD: Still negative – bearish momentum persists. Potential Scenario: Downtrend may continue if price fails to reclaim 63.90. |
 |
|
|
 |
|
|