FXEM - EMPIRE MARKETS - Company New Article
To access the website's classic version and the new accounts, please click here
Aug 08, 2025
 |
|
|
 |
||
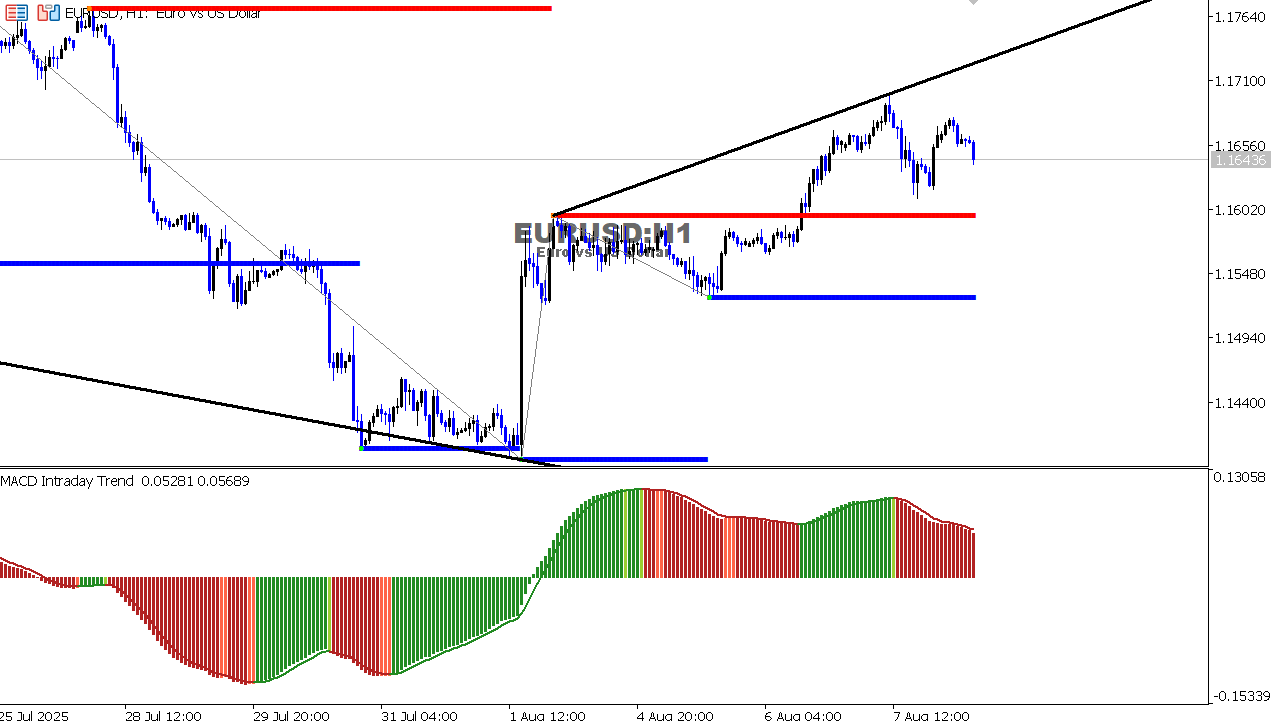
EUR/USD Chart on the hourtly time frameCurrent trend: Short-term uptrend after breaking the descending trendline. Support levels: 1.1500 – 1.1440 Resistance levels: 1.1655 – 1.1710 MACD: Still positive but starting to weaken, indicating a possible pullback before continuing upward. Summary: As long as the price remains above 1.1500, the upward bias remains. A break above 1.1600 would support further gains.
|