FXEM - EMPIRE MARKETS - Company New Article
To access the website's classic version and the new accounts, please click here
Aug 08, 2025
 |
|
|
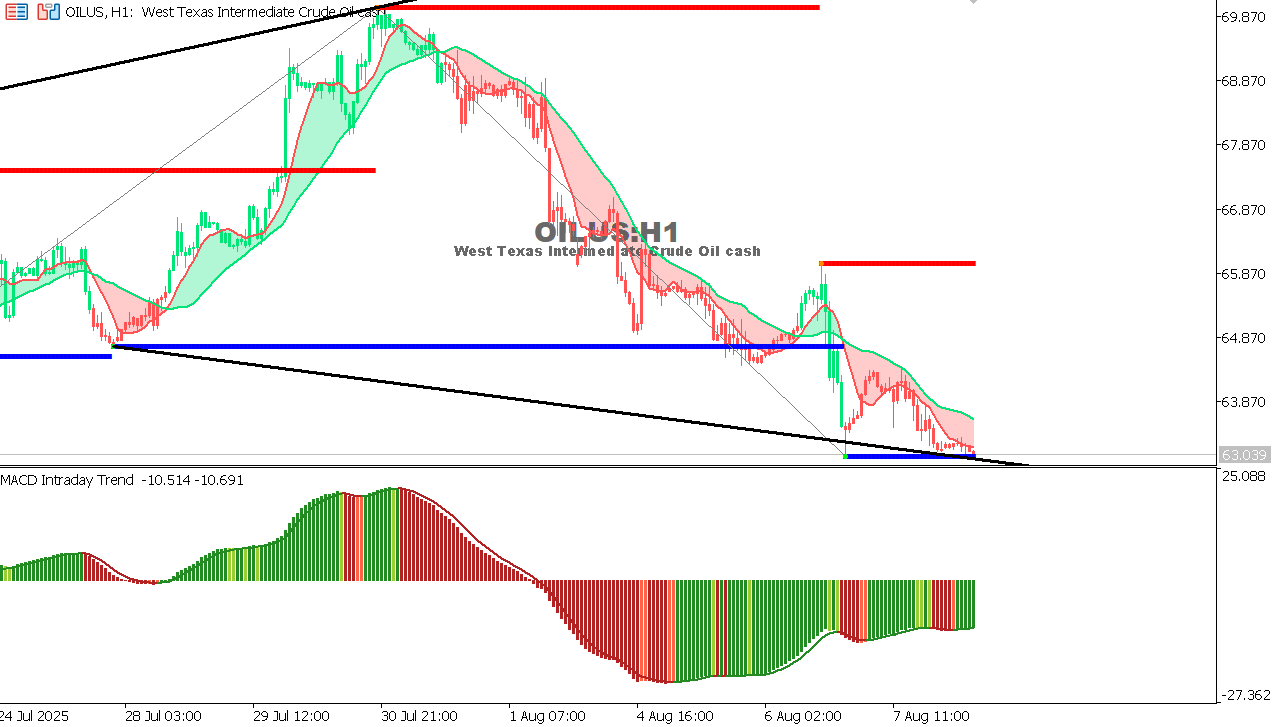 |
USOIL Chart on the hourtly time frameTrend: Bearish after breaking key support and upward trend. Support levels: 63.00 – 62.20 Resistance levels: 64.90 – 65.80 MACD: Bearish with strong downward momentum. Summary: Unless 65.00 is broken to the upside, the bias remains negative towards lower levels. |
 |
|
|
 |
|
|