FXEM - EMPIRE MARKETS - Company New Article
To access the website's classic version and the new accounts, please click here
Jan 16, 2026
 |
|
|
 |
||
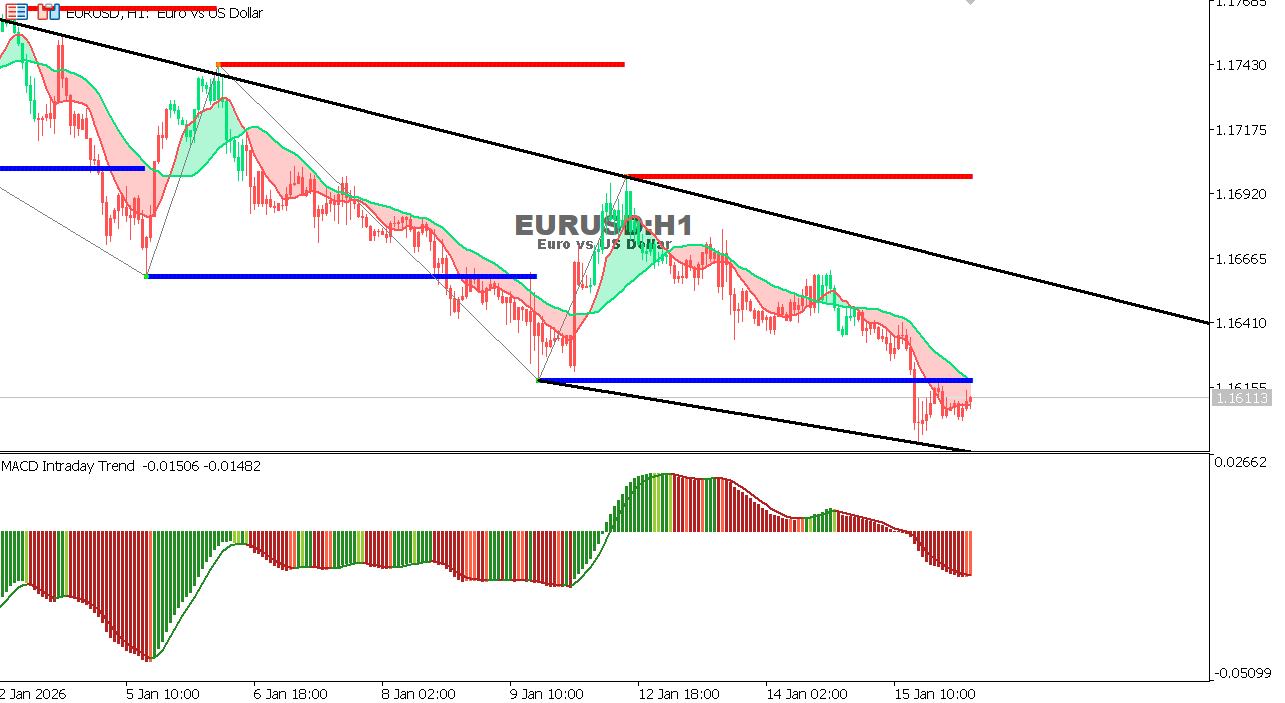
EUR/USD Chart on the hourtly time frameThe pair continues to move within a clear descending channel on the hourly timeframe, having failed to hold above the dynamic resistance levels and returning to trade near the lower boundary of the channel. Moving averages are still exerting downward pressure on the price, while the MACD indicator indicates continued negative momentum with clear weakness in the attempts to rebound. General Trend: Downward
|