FXEM - EMPIRE MARKETS - Company New Article
To access the website's classic version and the new accounts, please click here
Jan 15, 2026
 |
|
|
 |
||
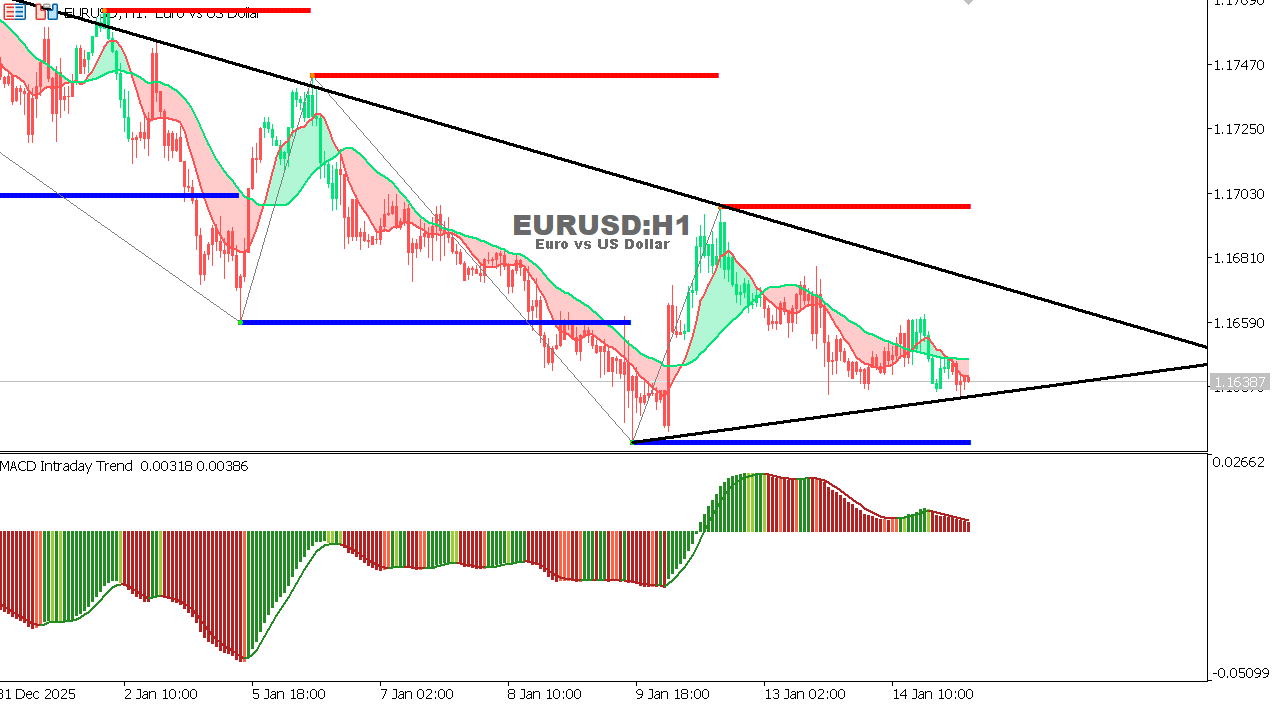
EUR/USD Chart on the hourtly time frameThe pair is moving within a descending symmetrical triangle pattern following a clear wave of selling pressure. The price is trading near the lower boundary of the triangle, reflecting a wait-and-see approach before a decisive breakout. Moving averages remain bearish, while the MACD shows weak downward momentum as sellers gradually lose strength. Overall trend: Neutral-bearish Expectation: A break below 1.1650 would confirm a continuation of the decline towards 1.1620, while a break above the upper boundary of the triangle near 1.1700 could trigger an upward correction towards 1.1745.
|