FXEM - EMPIRE MARKETS - Company New Article
To access the website's classic version and the new accounts, please click here
Jan 15, 2026
 |
|
|
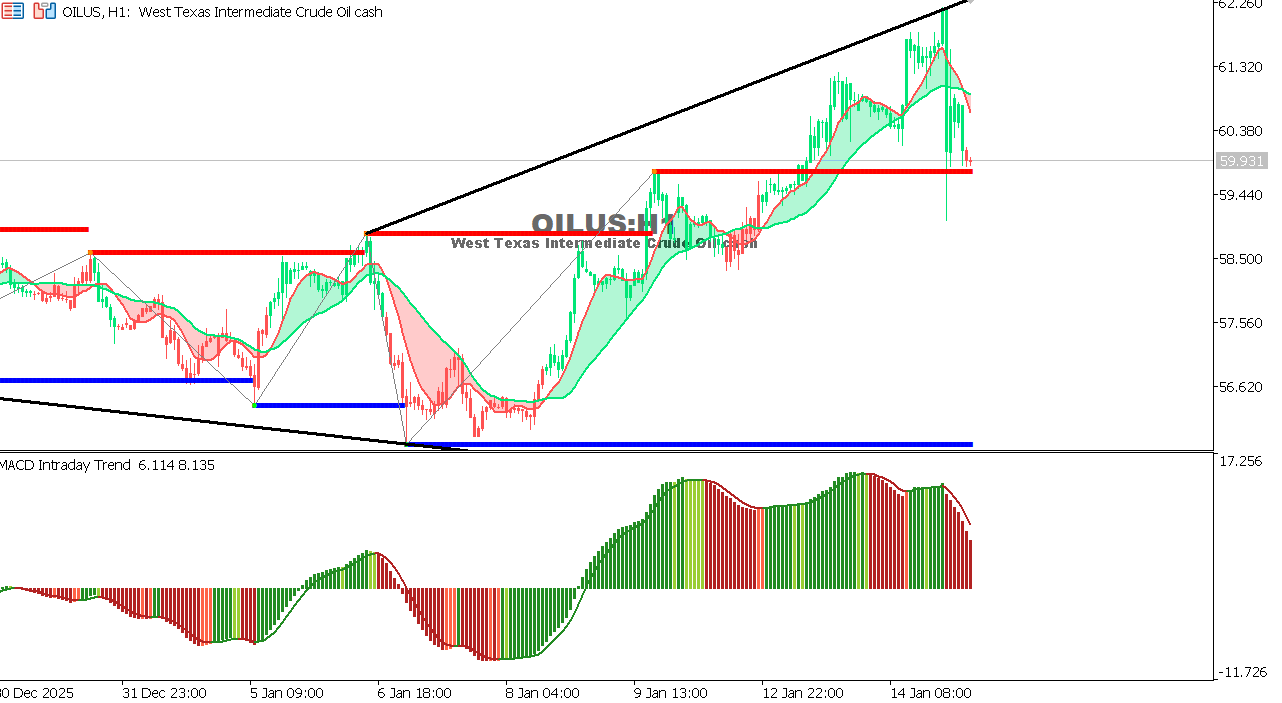 |
USOIL Chart on the hourly time frameOil is moving in a sideways range with a downward bias after failing to stabilize above 61.00, amid concerns about slowing global demand. The price is trading below its moving averages, while the MACD is showing weak negative momentum, indicating consolidation rather than a downward push. General Trend: Neutral with a slight downward bias Expectation: A break below 59.20 could bring renewed pressure towards 58.40, while a return above 60.80 would temporarily alleviate the negative sentiment. |
 |
|
|
 |
|
|