FXEM - EMPIRE MARKETS - Company New Article
To access the website's classic version and the new accounts, please click here
Jan 16, 2026
 |
|
|
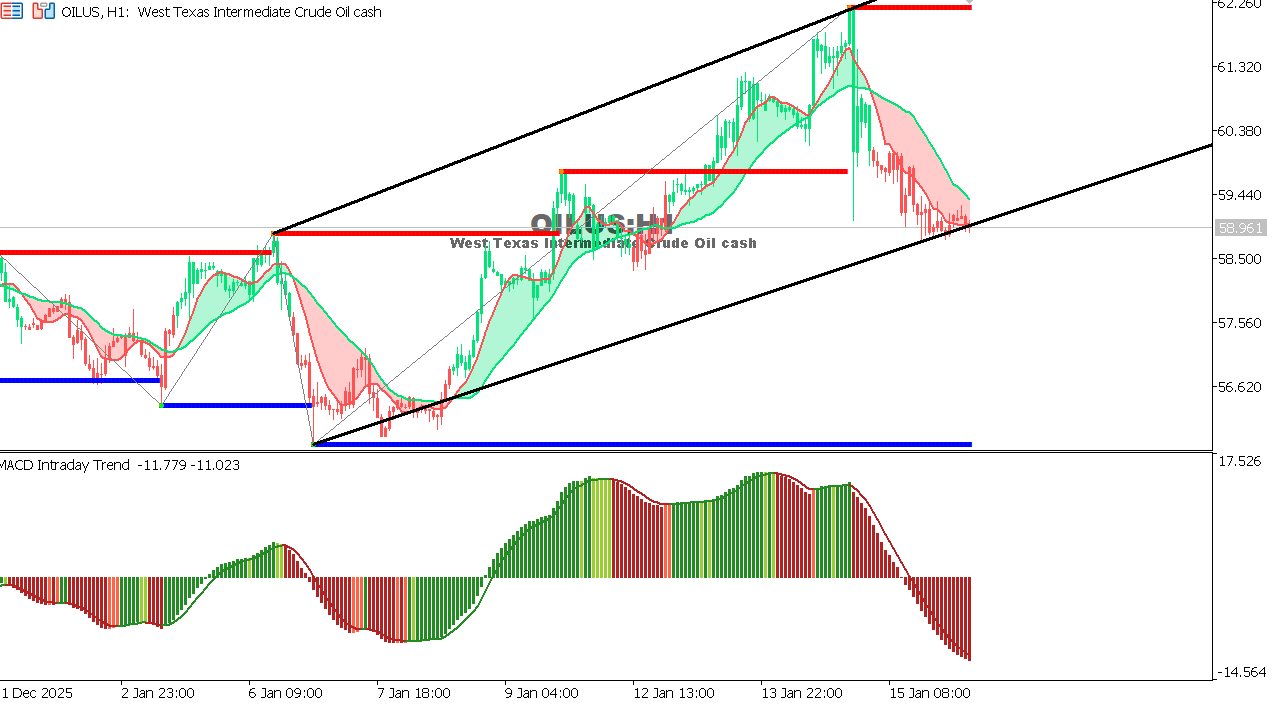 |
USOIL Chart on the hourly time frameOil is trading in a sideways range with a downward bias after several failed attempts to break through higher resistance levels, while pressure continues from the moving averages. Momentum is weak, and the MACD indicator is moving in negative territory, reflecting the fragility of the current rebound. Overall Trend: Neutral with a downward bias |
 |
|
|
 |
|
|