FXEM - EMPIRE MARKETS - Company New Article
To access the website's classic version and the new accounts, please click here
Sep 12, 2025
 |
|
|
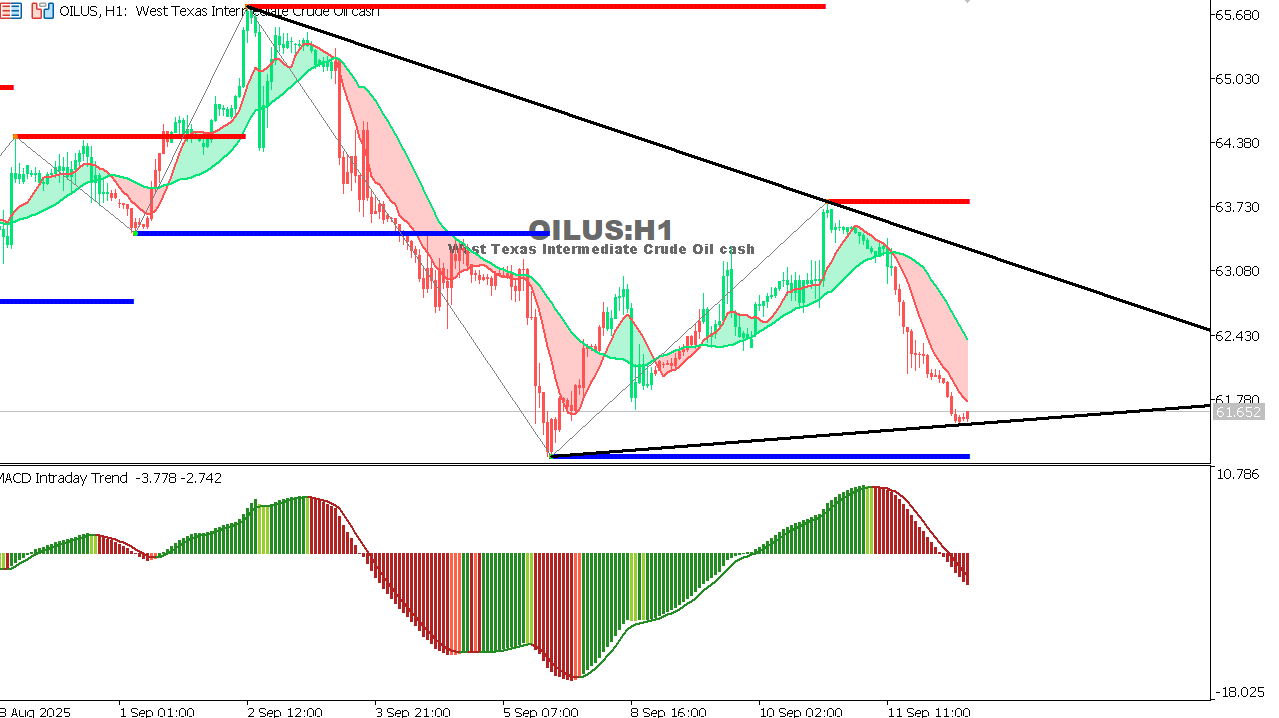 |
USOIL Chart on the hourtly time frameOverall Trend: Sideways to bearish, testing the lower channel boundary. Resistance: 63.70 - 64.30. Support: 61.65. MACD: Bearish, but slowing down. Analysis: Price is at a key support. A bounce from here could trigger a bullish reversal. However, a break below 61.65 opens the door to 60.00 or lower. |
 |
|
|
 |
|
A review of the report from yesterday, dated September 11, 2025. |