FXEM - EMPIRE MARKETS - Company New Article
To access the website's classic version and the new accounts, please click here
Sep 11, 2025
 |
|
|
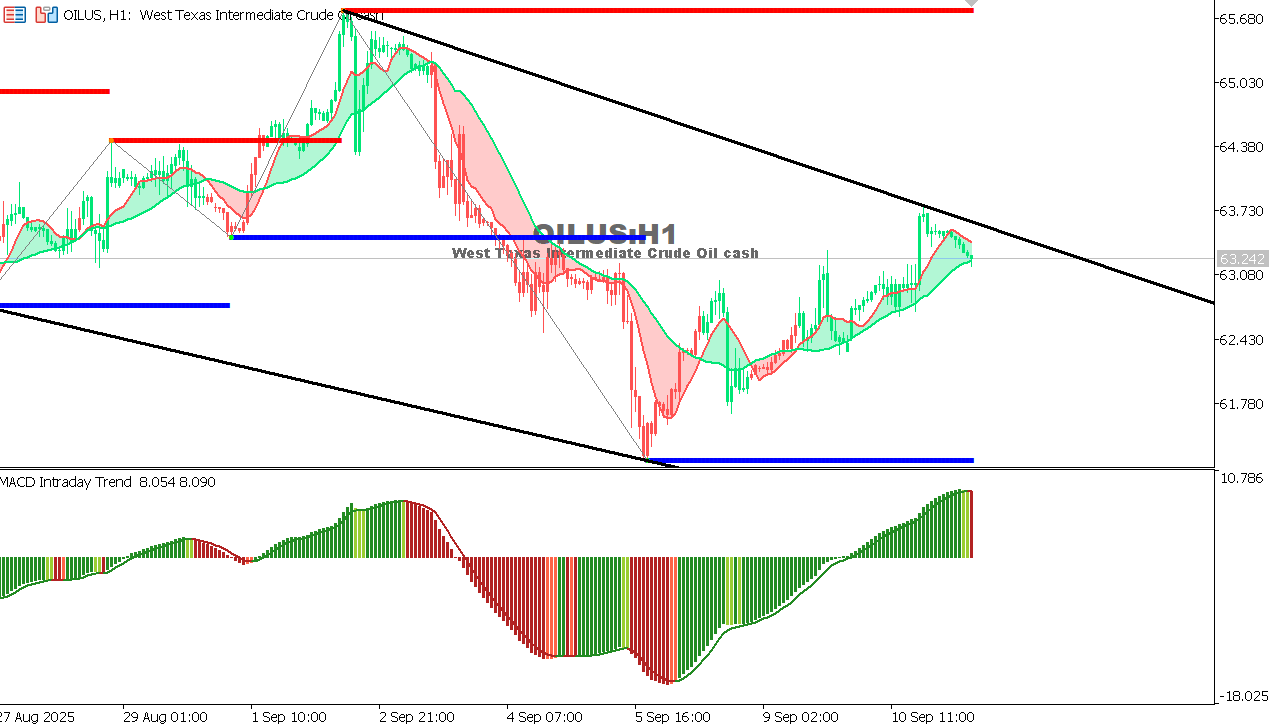 |
USOIL Chart on the hourtly time frameTrend: The oil price is showing a slight uptrend, but it’s under pressure and testing support near 62.430. Support & Resistance: Support is around 62.430, and resistance is at 65.680. MACD: The MACD is showing a positive trend, which is in alignment with the price trying to move upward. Outlook: Oil could experience a rally if support holds, but if it breaks support, it could correct further downwards. |
 |
|
|
 |
|
A review of the report from yesterday, dated September 10, 2025. |