FXEM - EMPIRE MARKETS - Company New Article
To access the website's classic version and the new accounts, please click here
Sep 12, 2025
 |
|
|
 |
||
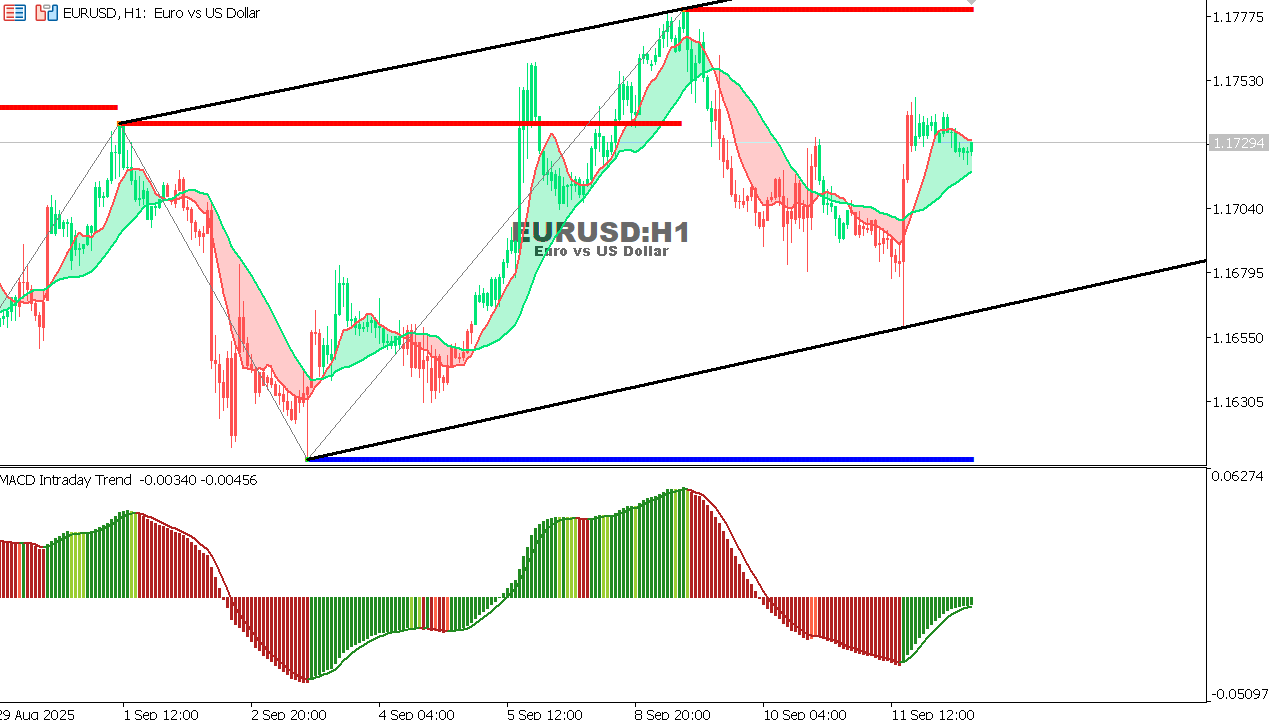
EUR/USD Chart on the hourtly time frameOverall Trend: Bullish, moving within a broadening channel. Resistance: Around 1.17775 (top of the channel). Support: Around 1.16795 (bottom of the channel). MACD: Turning positive, indicating growing bullish momentum. Analysis: Price is making higher highs and higher lows. As long as it's above 1.1700, the bias is bullish. A breakout above 1.17775 confirms further upside.
|
|
A review of the report from yesterday, dated September 11, 2025. |