FXEM - EMPIRE MARKETS - Company New Article
To access the website's classic version and the new accounts, please click here
Jun 23, 2025
 |
|
|
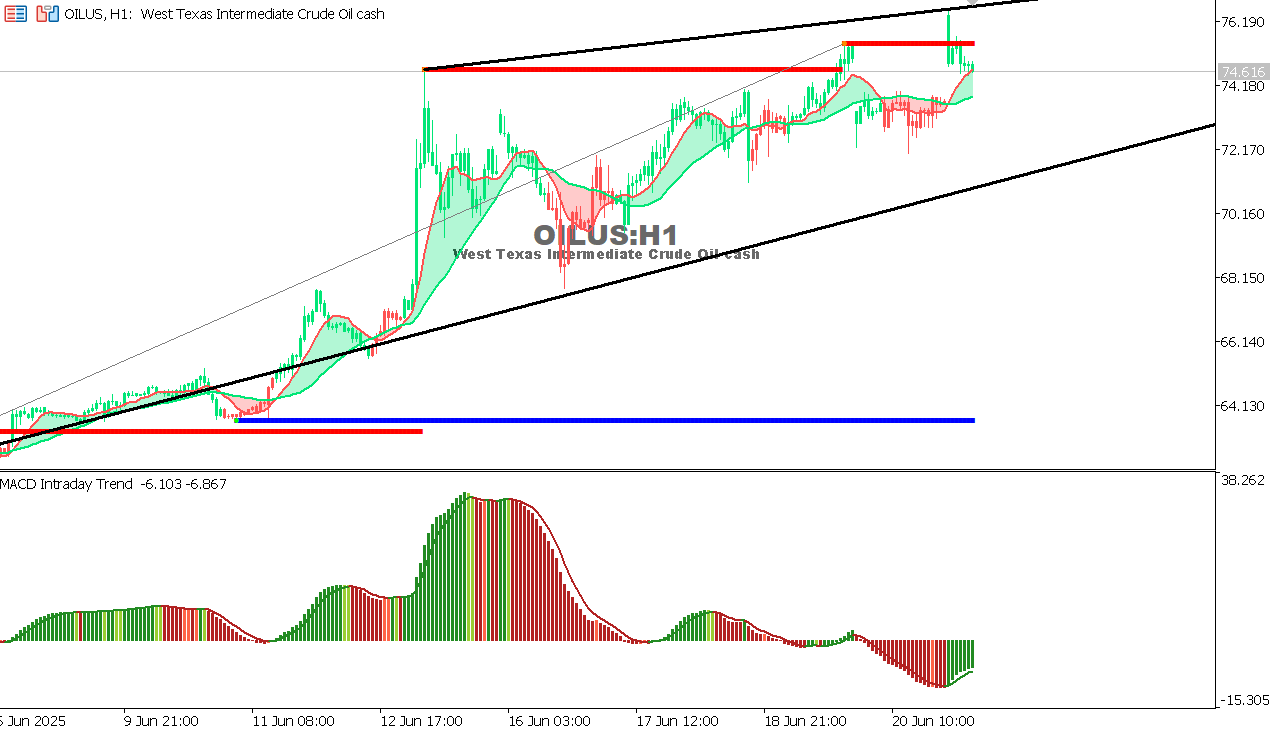 |
USOIL Chart on the hourtly time frame
Expectation: Continuation of movement within the ascending channel, and a break of 76.00 could open the way towards 77.80. A break of 73.30 temporarily negates the bullish scenario. |
 |
|
|
 |
|
|