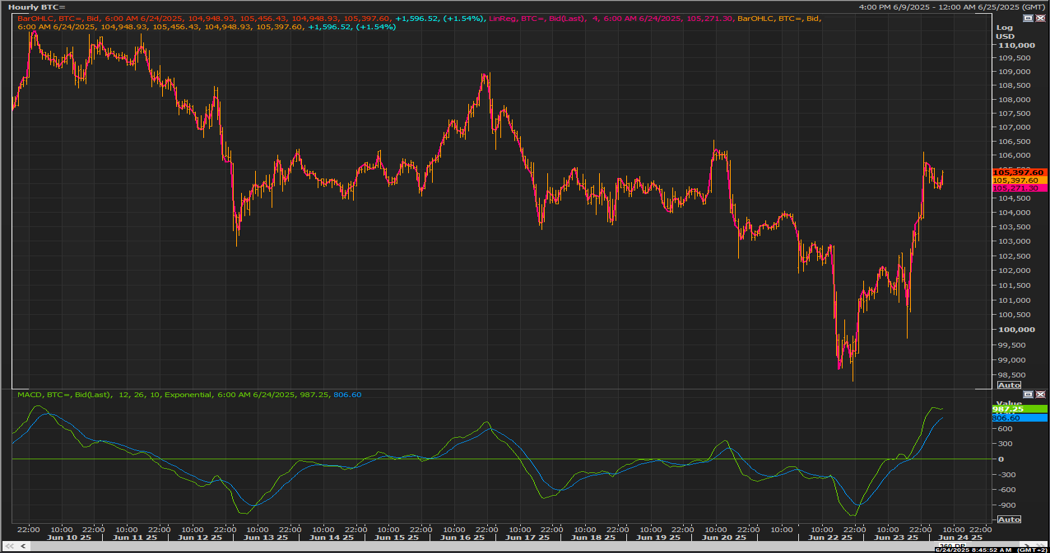
Previously, we wrote; “BTC, saw a drop last Friday and closed below 100.4K support. Yet Today, BTC managed to trade back above this level and is currently trading at 102K.
We expect BTC to recover back to (103 – 103.5)K range. Before finding some resistance once more.”
BTC recovery back to (103 – 103.5)K range and pushed further towards 106k area. At this point, we deem the 106.5K level as a resistance level. Unless we see BTC breaking above this level, we would expect BTC to pullback.
This website uses cookies to ensure you get the best experience on our website. We use cookies for proper website navigation and function and for statistical and analytical purposes. You can select the cookie categories that you would like to manage through the Cookies Settings at any time. Please configure your Cookies Settings before proceeding. To learn more, please read our Cookies Policy
We use cookies to ensure the best possible experience as a guest in our site. Please configure your cookies settings before proceeding.
Necessary
Always active
These cookies are strictly necessary to enable you to move about the website and to provide certain features you have requested. There is no need for consent for the use of such cookies.