FXEM - EMPIRE MARKETS - Company New Article
To access the website's classic version and the new accounts, please click here
Aug 29, 2025
 |
|
|
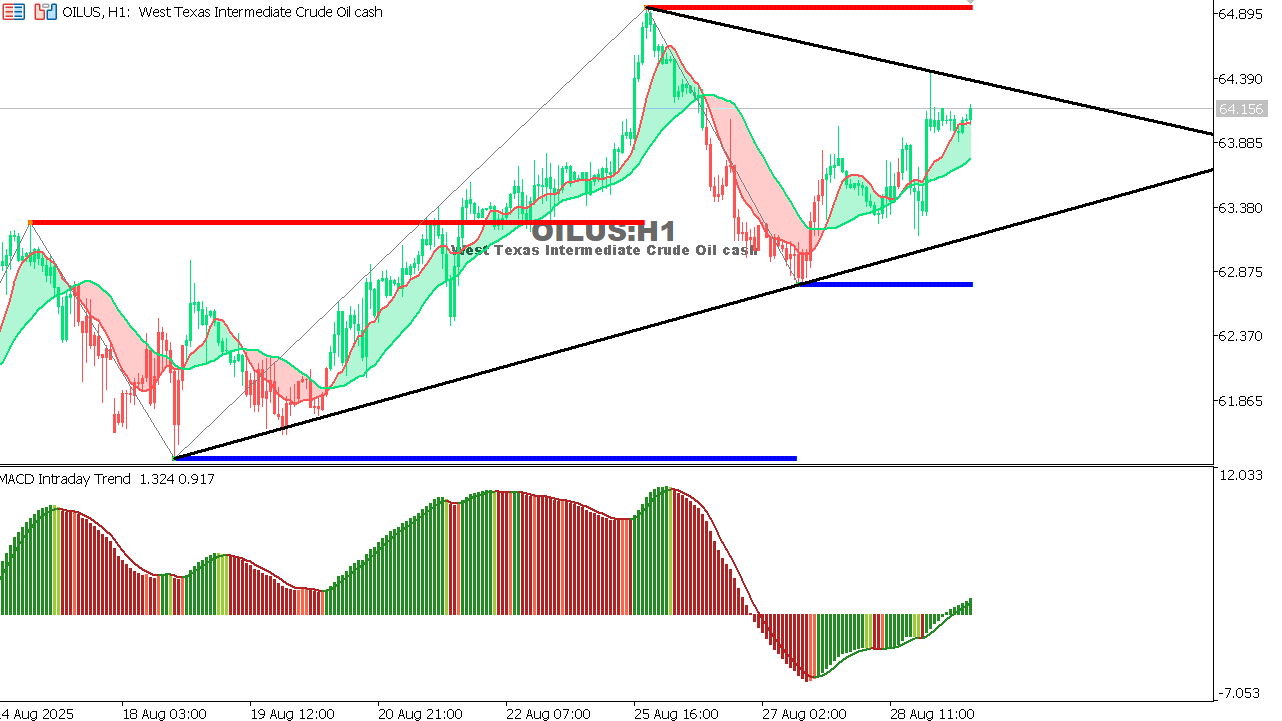 |
USOIL Chart on the hourtly time frameTrend: Corrective phase within ascending triangle. Support: 62.87. Resistance: 64.39. Outlook: Price is near the upper trendline. Break above 64.39 suggests continuation toward 65+. Failure may lead to a pullback near 63.00. |
 |
|
|
 |
|
|