FXEM - EMPIRE MARKETS - Company New Article
To access the website's classic version and the new accounts, please click here
Sep 01, 2025
 |
|
|
 |
||
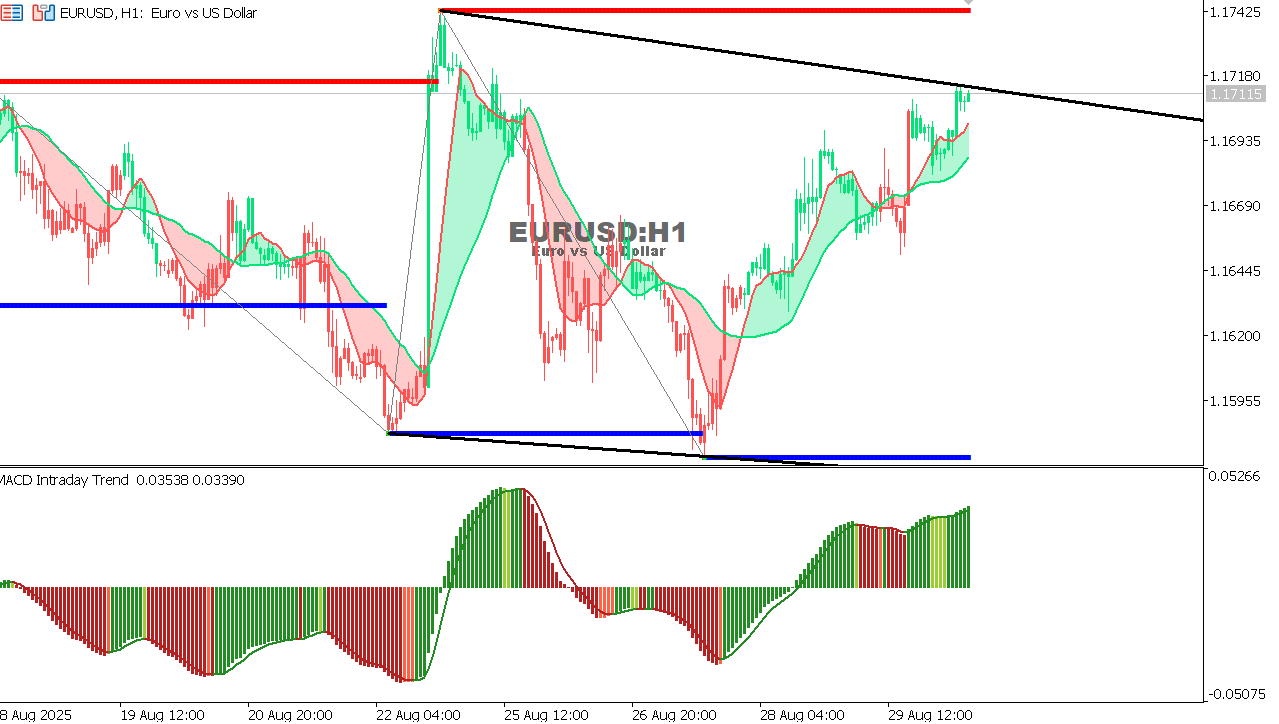
EUR/USD Chart on the hourtly time frameChart Pattern: Symmetrical Triangle Current Status: Price is testing the upper boundary of the triangle. Indicators:
Outlook: A breakout above 1.1715–1.1720 may lead to a bullish move toward 1.1745, then 1.1780. Failure to break out could push price down toward 1.1620.
|