FXEM - EMPIRE MARKETS - Company New Article
To access the website's classic version and the new accounts, please click here
Aug 29, 2025
 |
|
|
 |
||
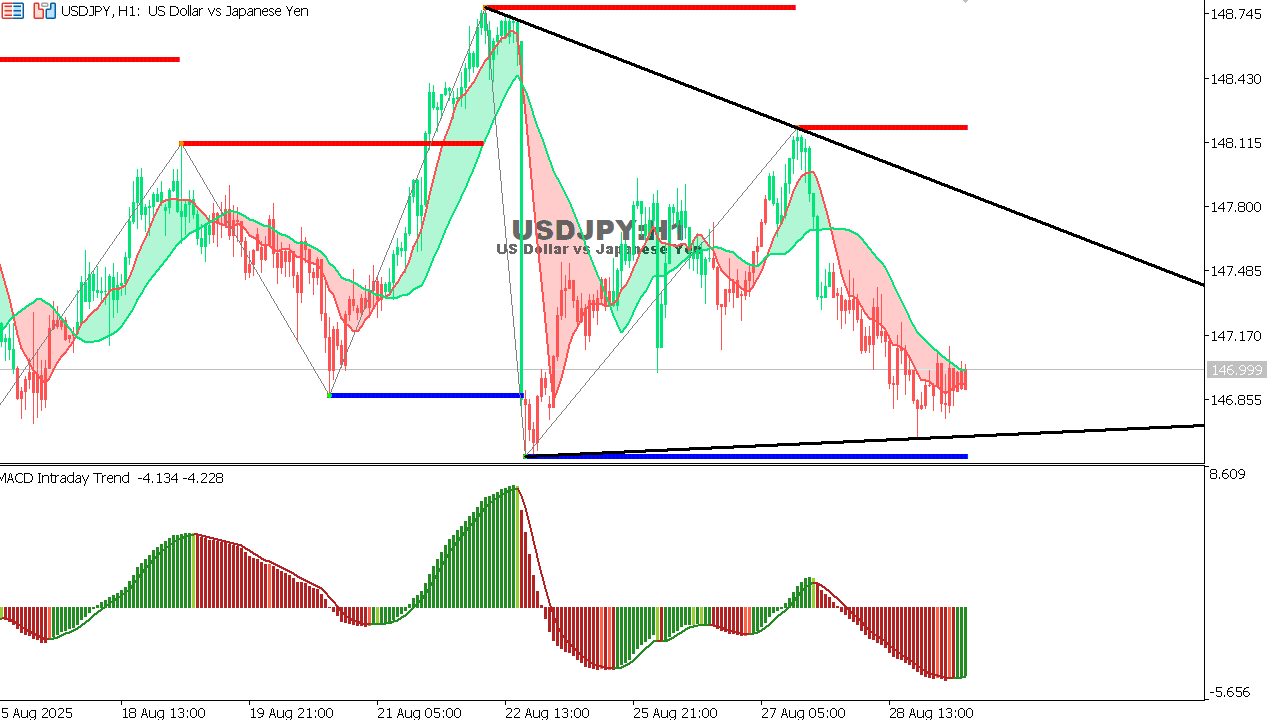
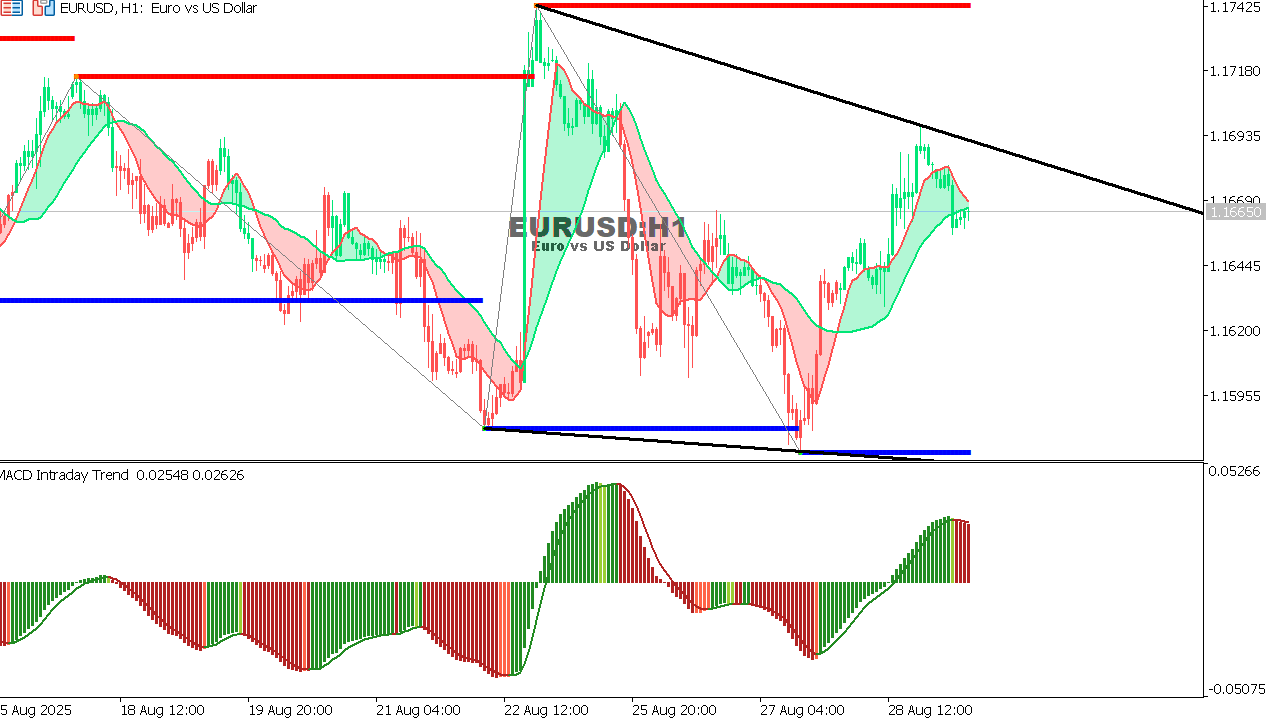
EUR/USD Chart on the hourtly time frameTrend: Bullish rebound from strong support. Pattern: Descending triangle + bullish divergence on MACD. Resistance levels: 1.1690 – 1.1740 (upper trendline and red zone). Support levels: 1.1580 – 1.1600. Outlook: Potential upside to test 1.1690 area. A breakout above that could open the door for further gains.
|