FXEM - EMPIRE MARKETS - Company New Article
To access the website's classic version and the new accounts, please click here
Aug 28, 2025
 |
|
|
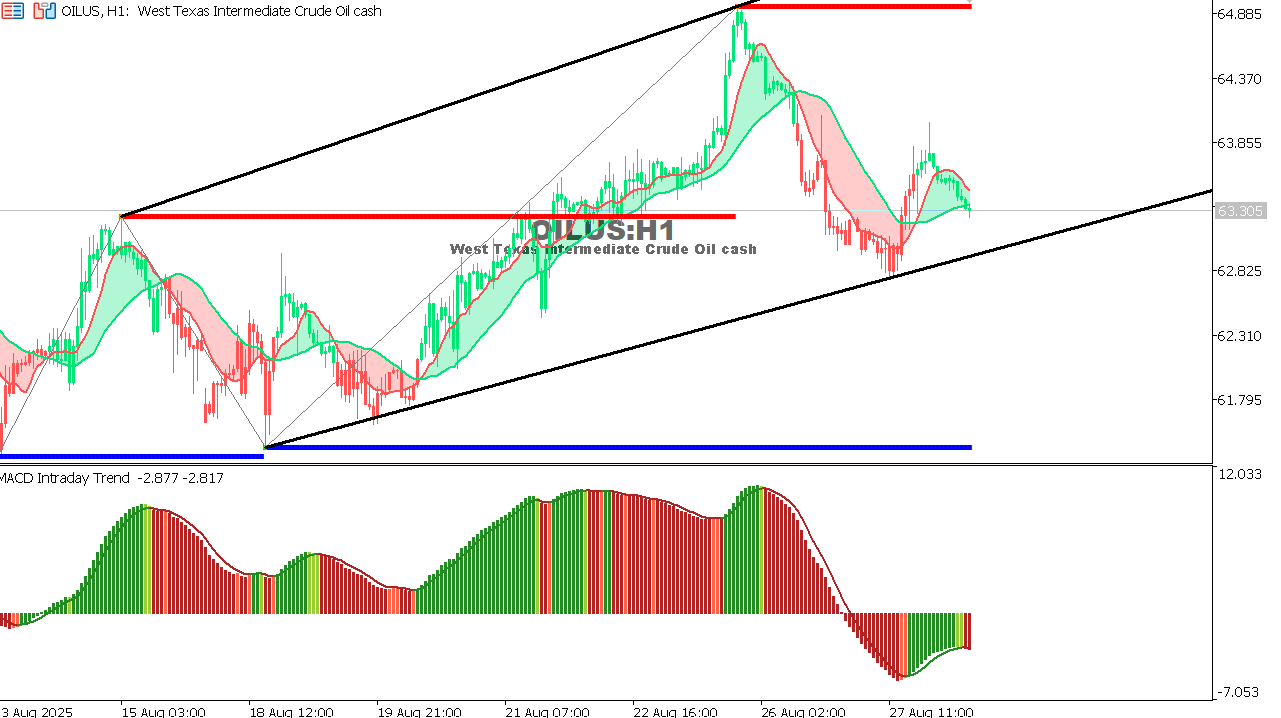 |
USOIL Chart on the hourtly time framePattern: Rising Channel Support: 62.80 – 63.00 Resistance: 64.85 MACD: Slightly bearish but weakening Outlook: Price is in a pullback within an uptrend. Holding above 63.00 supports further upside. A break below may send price toward 62.30. |
 |
|
|
 |
|
|