FXEM - EMPIRE MARKETS - Company New Article
To access the website's classic version and the new accounts, please click here
Sep 22, 2025
 |
|
|
 |
||
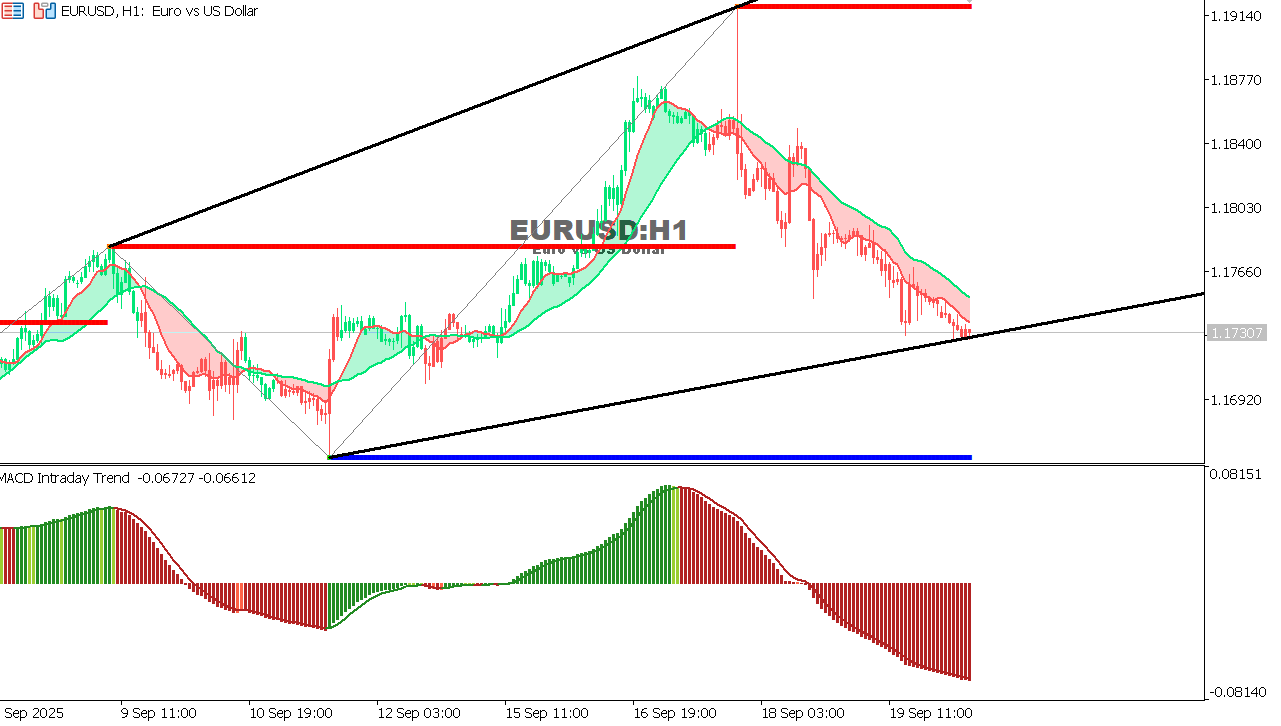
EUR/USD Chart on the hourtly time frameThe pair is trading near 1.1730 after a clear bearish move.
Staying below 1.1780 keeps bearish pressure intact, with chances to test 1.1700, especially as the MACD remains in negative territory.
|