FXEM - EMPIRE MARKETS - Company New Article
To access the website's classic version and the new accounts, please click here
Sep 22, 2025
 |
|
|
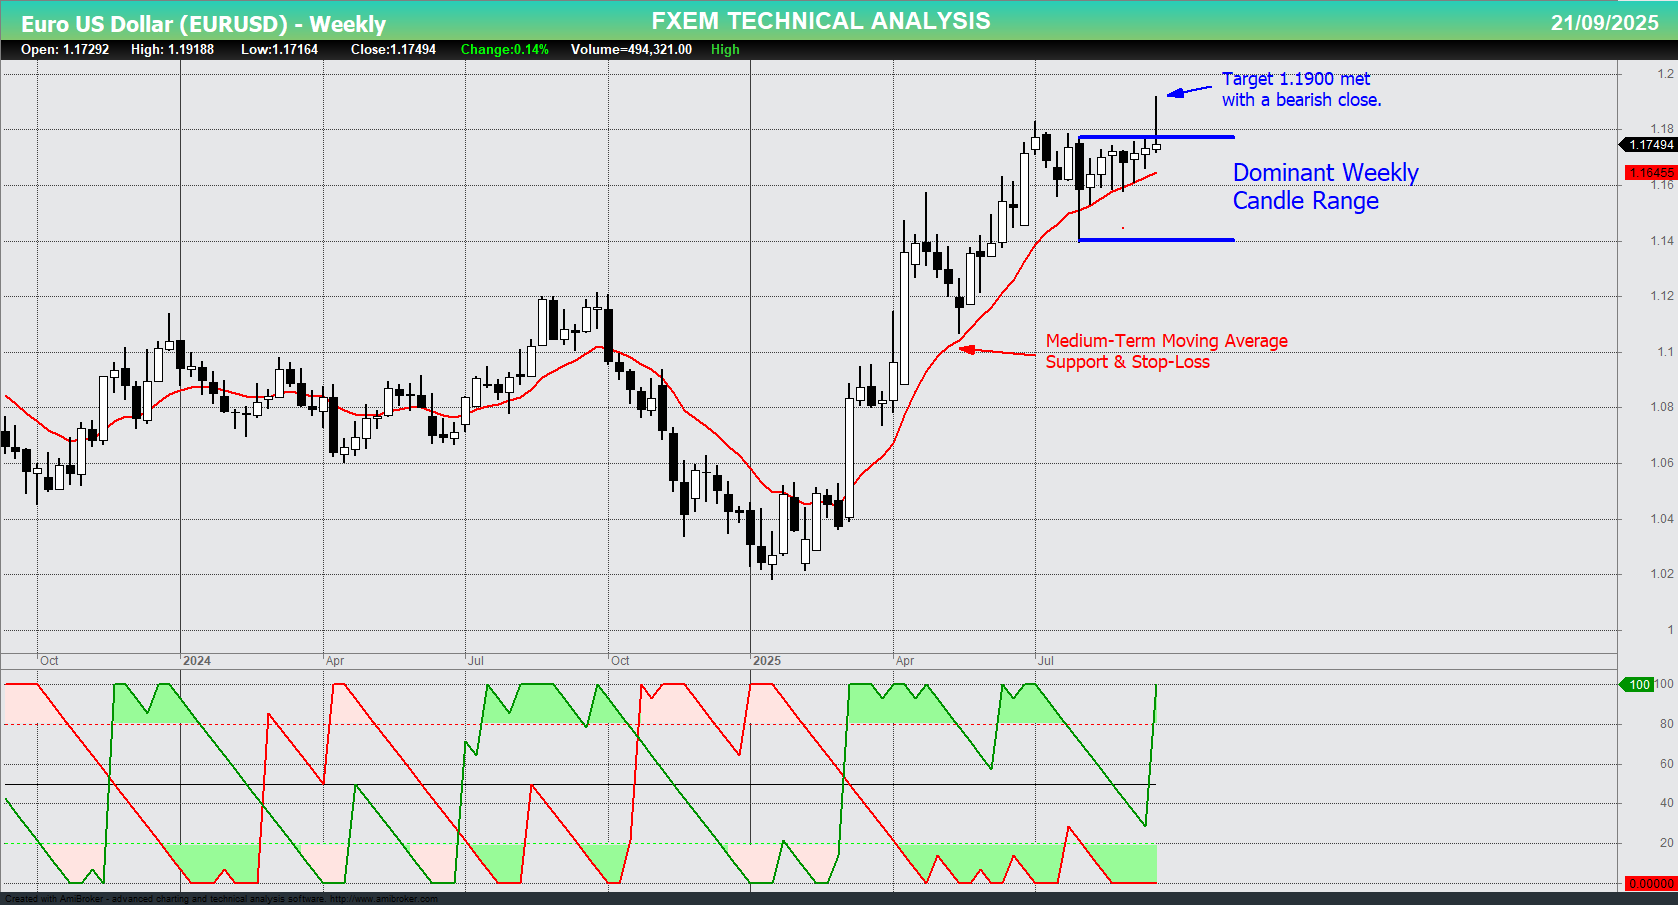 |
EURUSD Chart on the weekly time frameIn alignment with the prior bullish forecast, the EURUSD pair achieved the initial short-term objective at the 1.1900 level. At this juncture, significant selling pressure emerged, catalyzing a rejection that returned price action to the established weekly trading range, which has contained price movement for the past seven weeks. This sell-off culminated in the formation of a bearish weekly shooting star candlestick pattern, a development warranting close attention. A break below the previous week's low of 1.1716 is likely to trigger short-term stop-loss orders. From a medium-term perspective, a prudent risk management approach involves employing a trailing stop-loss, benchmarked against the 13-week exponential moving average—a level that has consistently provided dynamic support throughout the year. Conversely, a weekly close above the 1.1800 level would be construed as a constructive medium-term signal, potentially facilitating a further advance toward a secondary medium-term target zone between 1.2000 and 1.2100 |
 |
|
|