FXEM - EMPIRE MARKETS - Company New Article
To access the website's classic version and the new accounts, please click here
Sep 19, 2025
 |
|
|
 |
||
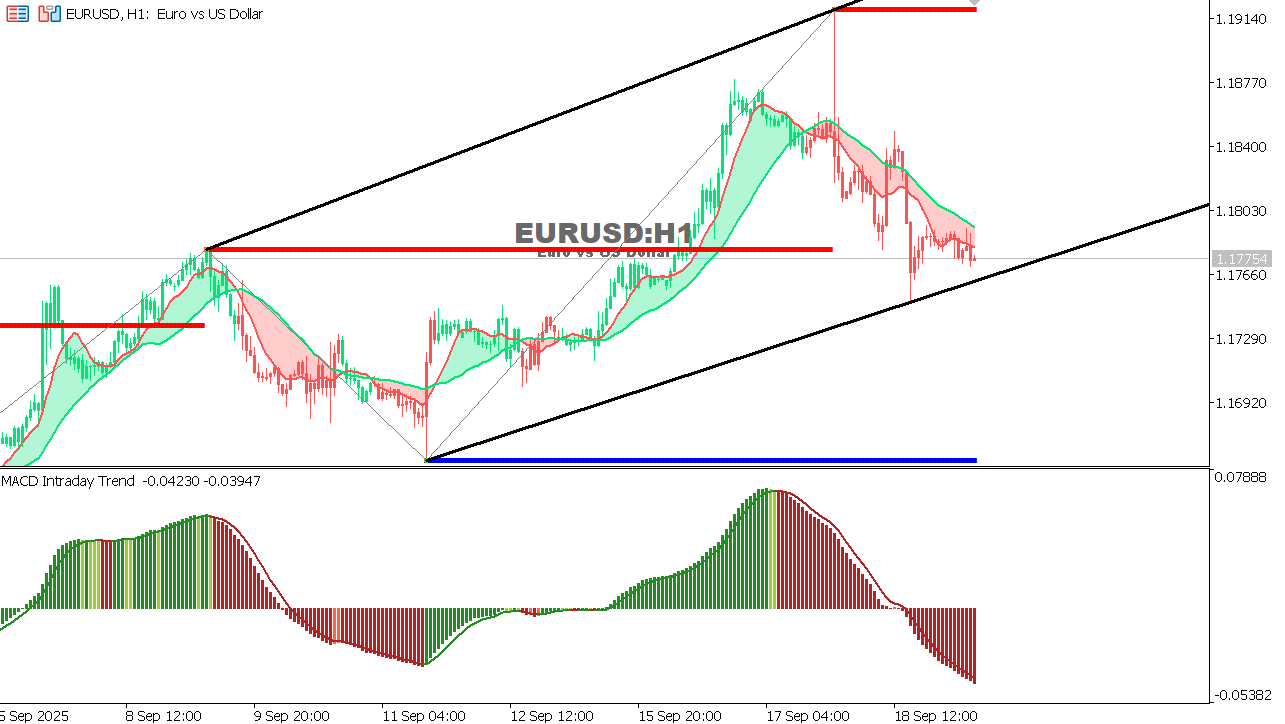
EUR/USD Chart on the hourtly time frameThe euro is moving near 1.1775 within an ascending channel but is approaching its lower boundary.
|