FXEM - EMPIRE MARKETS - Company New Article
To access the website's classic version and the new accounts, please click here
Sep 22, 2025
 |
|
|
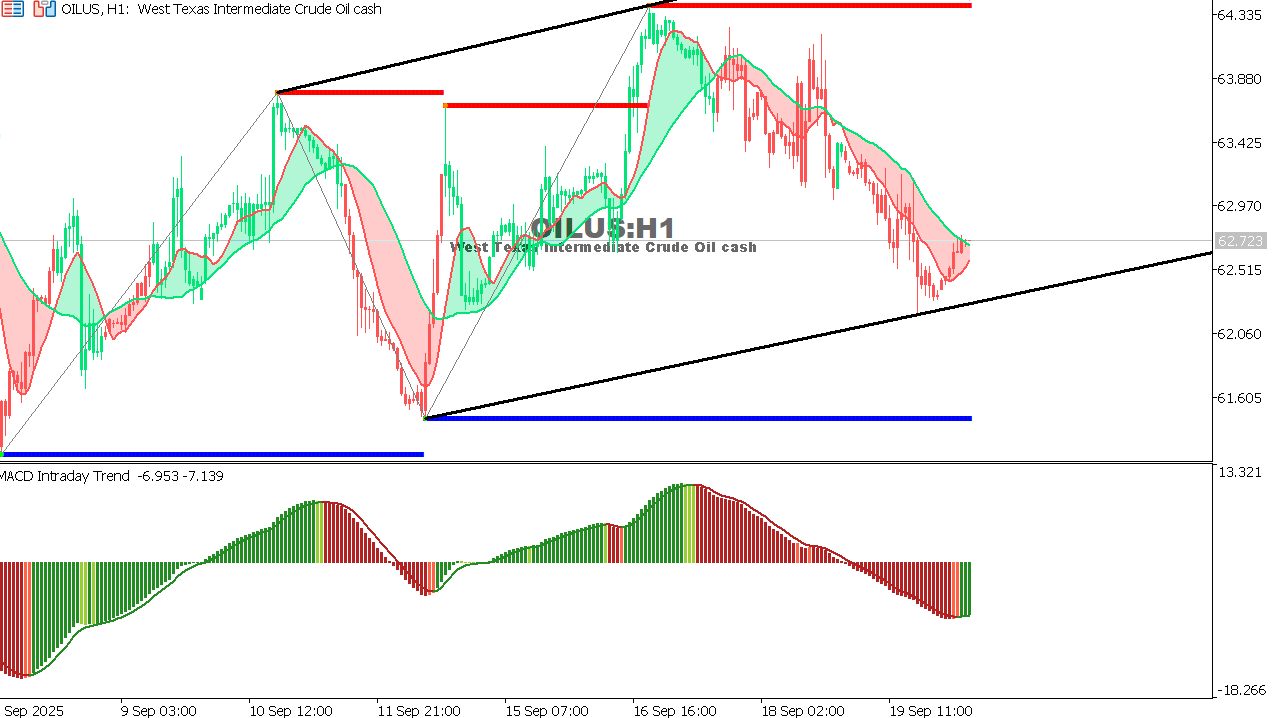 |
USOIL Chart on the hourtly time frameCrude is trading near 62.72 after a downward move.
Staying below 63.50 pressures prices toward 62.00, while a breakout above 63.50 could restore bullish momentum.
|
 |
|
|
 |
|
A review of the report from the past week dated September 19, 2025. |