FXEM - EMPIRE MARKETS - Company New Article
To access the website's classic version and the new accounts, please click here
Sep 17, 2025
 |
|
|
 |
||
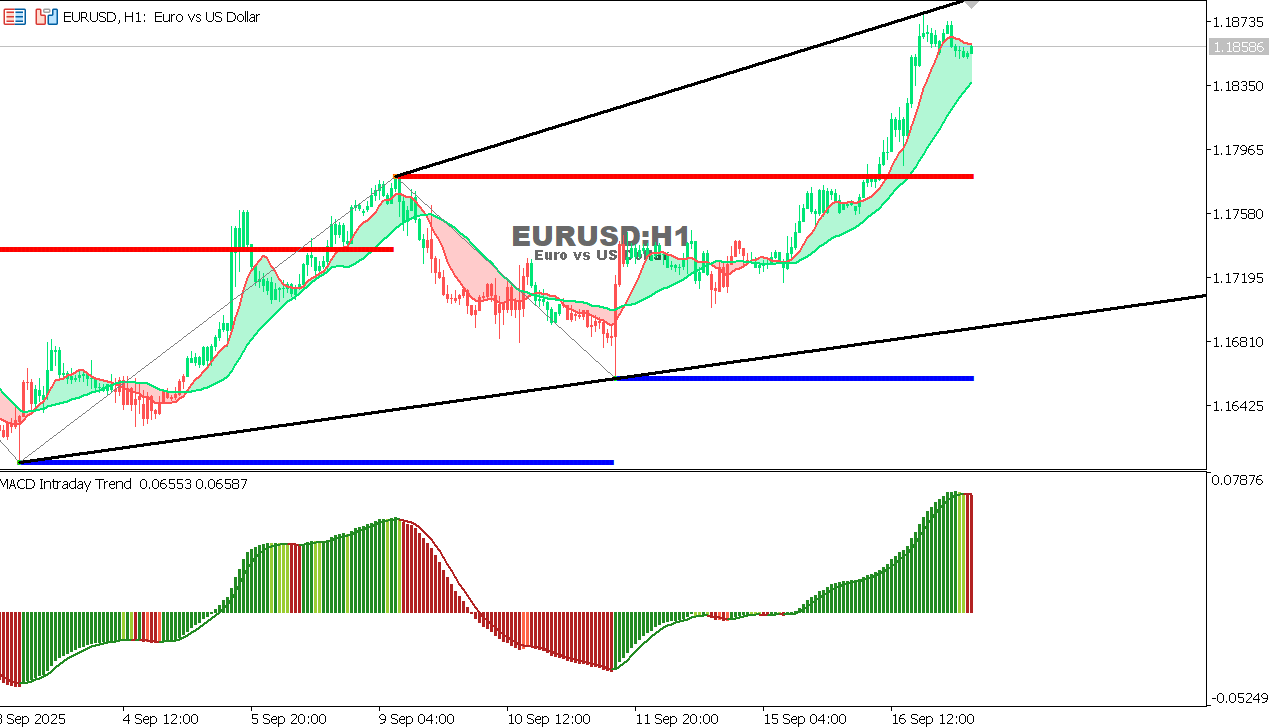
EUR/USD Chart on the hourtly time frame
Expectation: Continued upward momentum is contingent upon stability above 1.1795. A break above it could open the way for a decline towards 1.1710.
|