FXEM - EMPIRE MARKETS - Company New Article
To access the website's classic version and the new accounts, please click here
Sep 17, 2025
 |
|
|
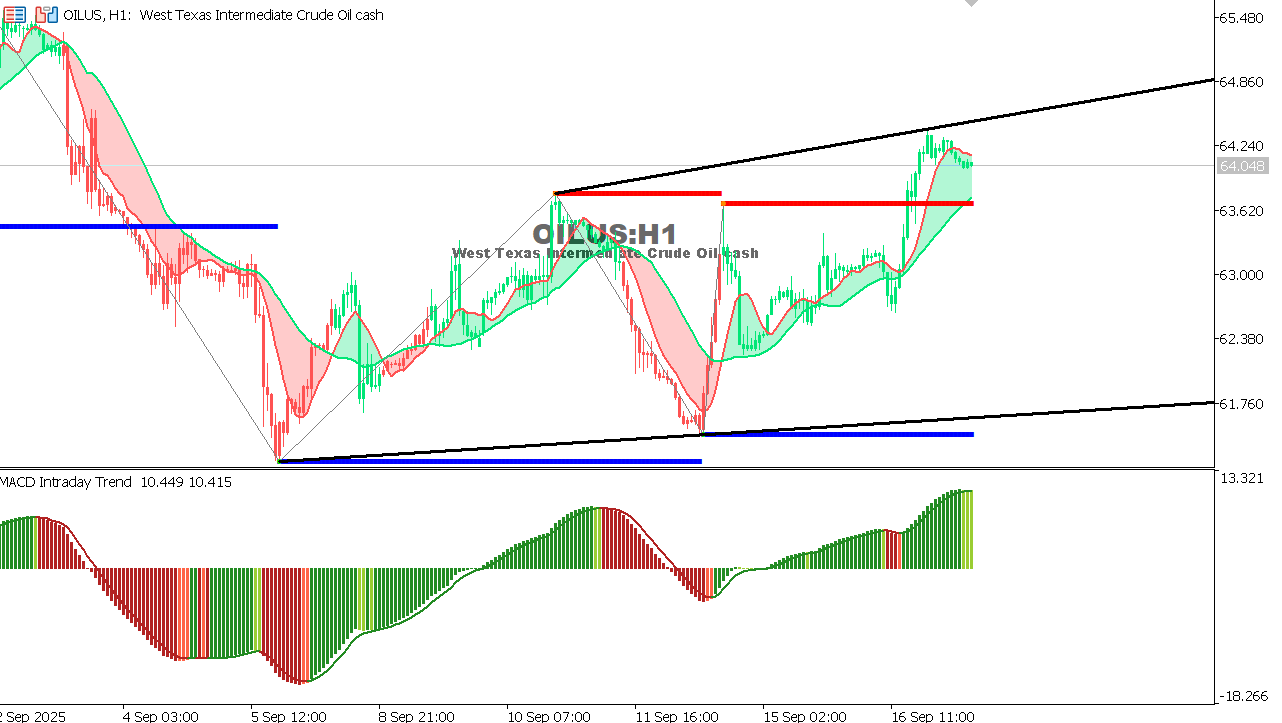 |
USOIL Chart on the hourtly time frame
Expectation: A break above 64.50 could extend the rise towards 65.00, while a failure could lead to a downward correction towards 63.60. |
 |
|
|
 |
|
|