FXEM - EMPIRE MARKETS - Company New Article
To access the website's classic version and the new accounts, please click here
Sep 16, 2025
 |
|
|
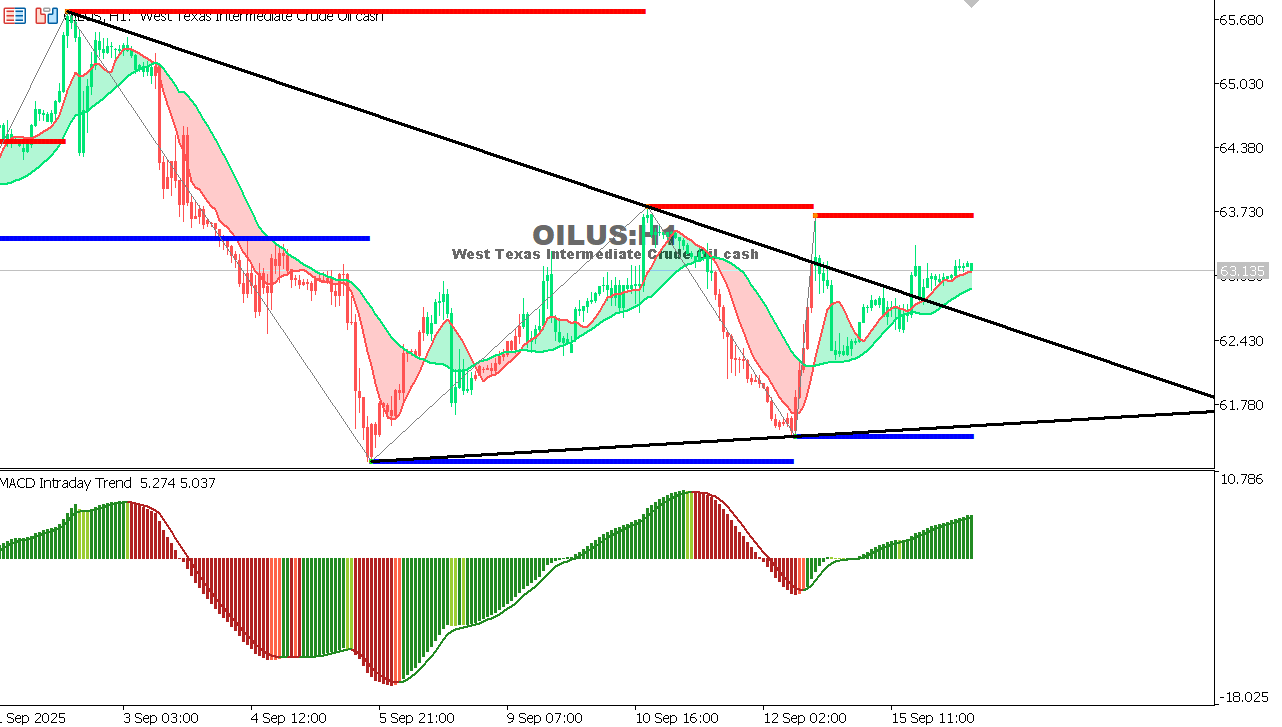 |
USOIL Chart on the hourtly time frameTrend: Neutral inside a triangle Pattern: Symmetrical triangle Resistance: 63.73 Support: 61.78 MACD: Slightly bullish Analysis: Oil is trying to break the triangle to the upside. A confirmed break above 63.73 opens room toward 65+. Downside break invalidates this. |
 |
|
|
 |
|
|