FXEM - EMPIRE MARKETS - Company New Article
To access the website's classic version and the new accounts, please click here
Sep 16, 2025
 |
|
|
 |
||
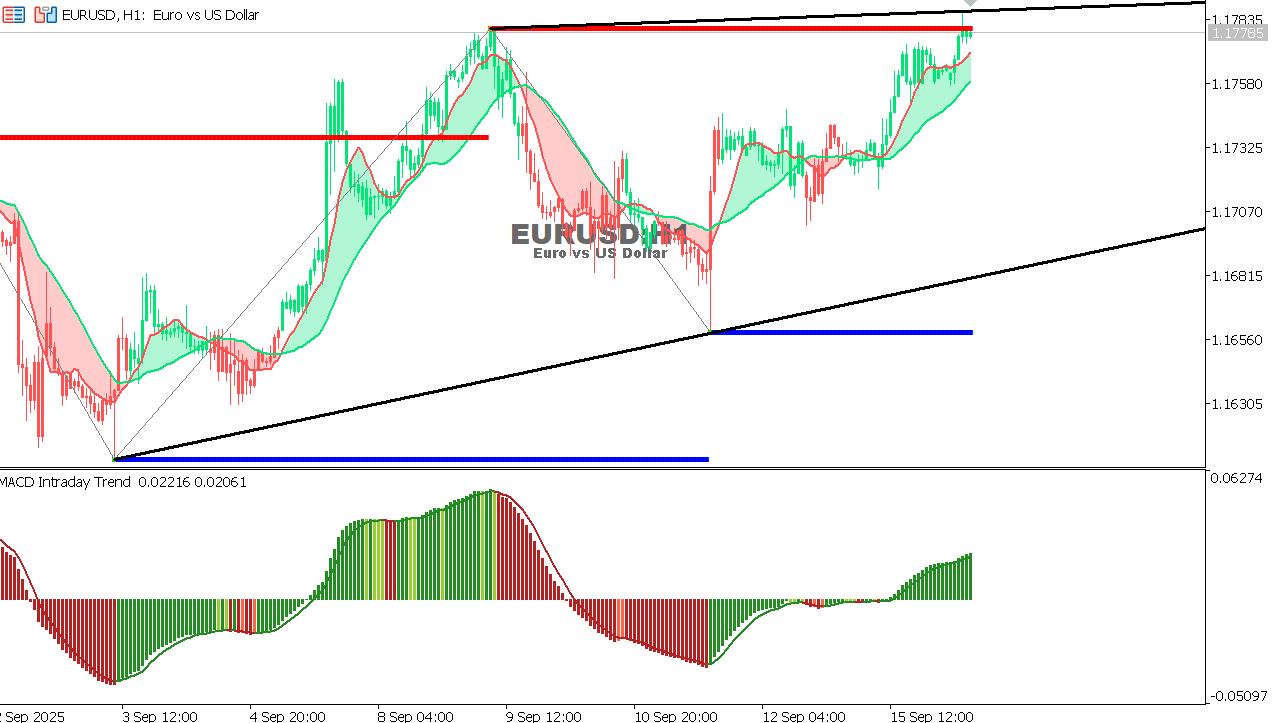
EUR/USD Chart on the hourtly time frameTrend: Bullish Pattern: Symmetrical triangle (bullish breakout potential) Resistance: 1.1785 (key horizontal level) Support: 1.1700 and 1.1656 (ascending trendline + blue support) MACD: Bullish momentum Analysis: The pair is testing strong resistance. If it breaks above 1.1785, further upside is expected. If not, expect a pullback toward 1.1700–1.1656.
|