FXEM - EMPIRE MARKETS - Company New Article
To access the website's classic version and the new accounts, please click here
Sep 01, 2025
 |
|
|
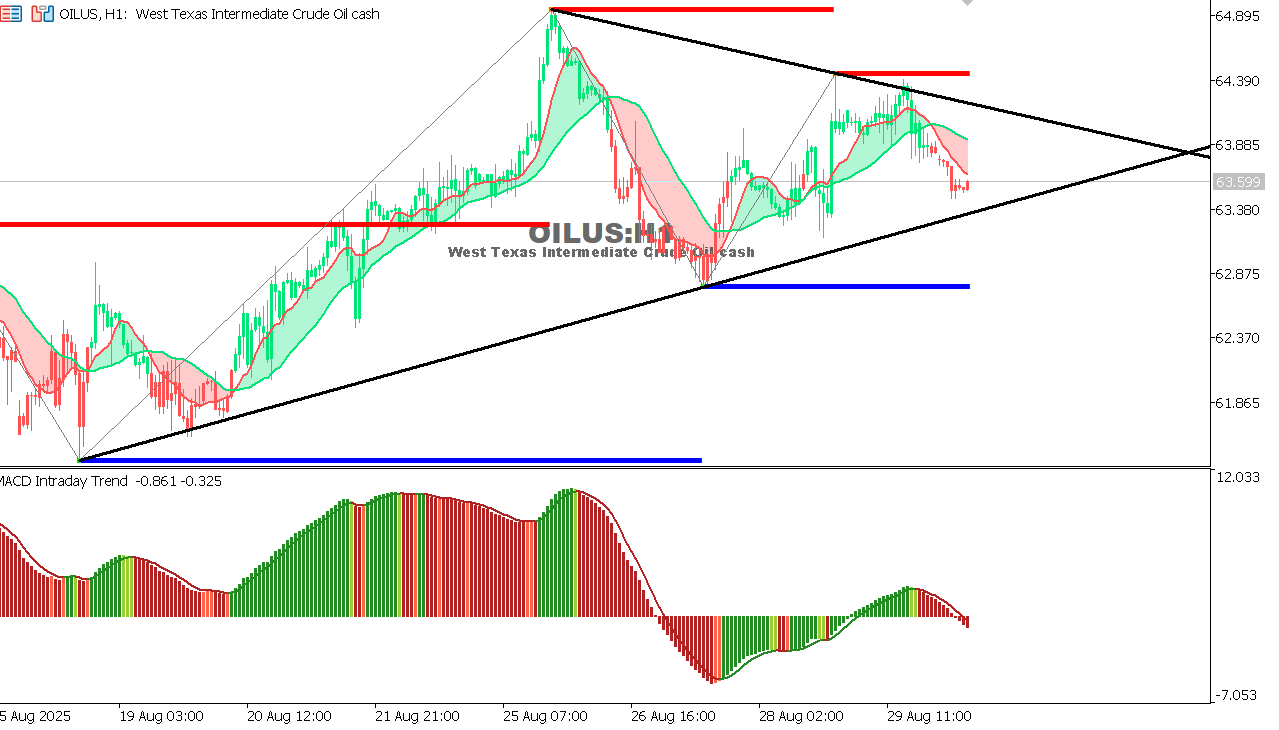 |
USOIL Chart on the hourtly time frameChart Pattern: Symmetrical Triangle Current Status: Leaning bearish inside the triangle. Indicators:
Outlook: A break below 62.85 could lead to 62.00, then 61.40. A break above 64.40 may reverse the trend to the upside. |
 |
|
|
 |
|
|