FXEM - EMPIRE MARKETS - Company New Article
To access the website's classic version and the new accounts, please click here
Aug 28, 2025
 |
|
|
 |
||
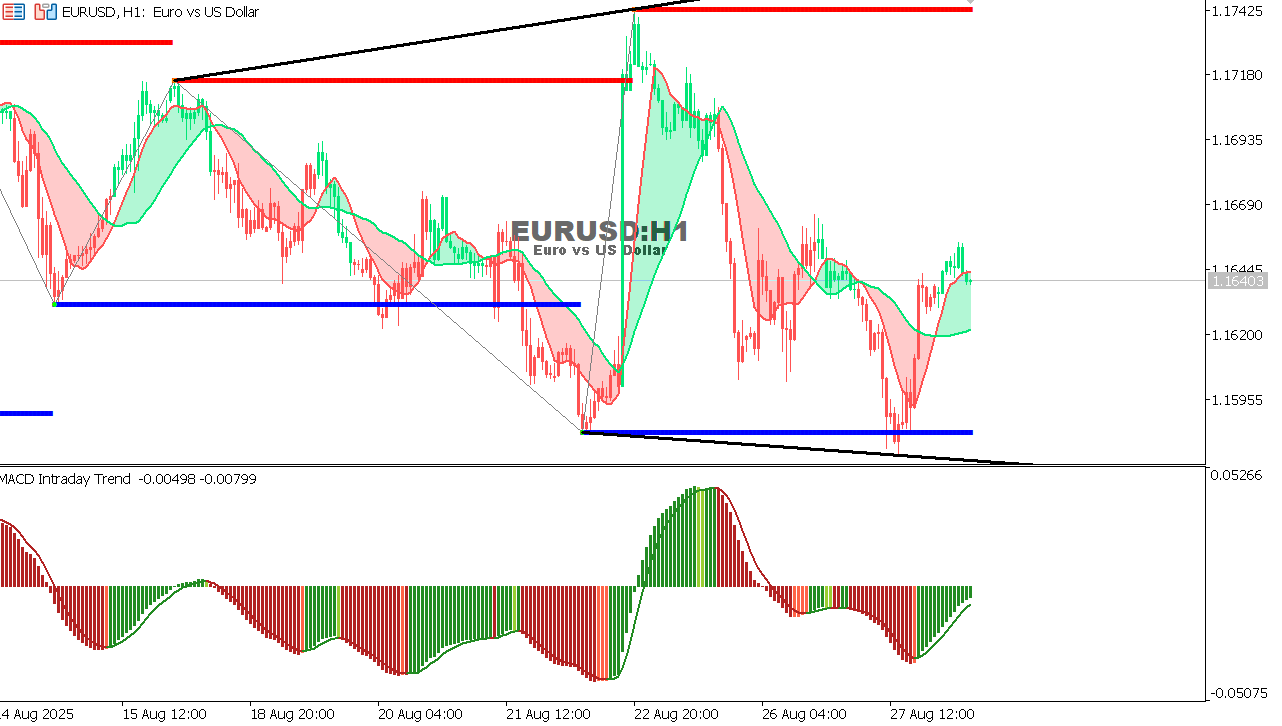
EUR/USD Chart on the hourtly time framePattern: Symmetrical Triangle Support: 1.1590 – 1.1600 Resistance: 1.1740 MACD: Showing early bullish signs but not confirmed yet Outlook: Price is consolidating inside the triangle. A break above resistance could lead to a bullish move toward 1.1740+. A breakdown below support may trigger a drop toward 1.1600 or lower.
|