FXEM - EMPIRE MARKETS - Company New Article
To access the website's classic version and the new accounts, please click here
Jan 14, 2026
 |
|
|
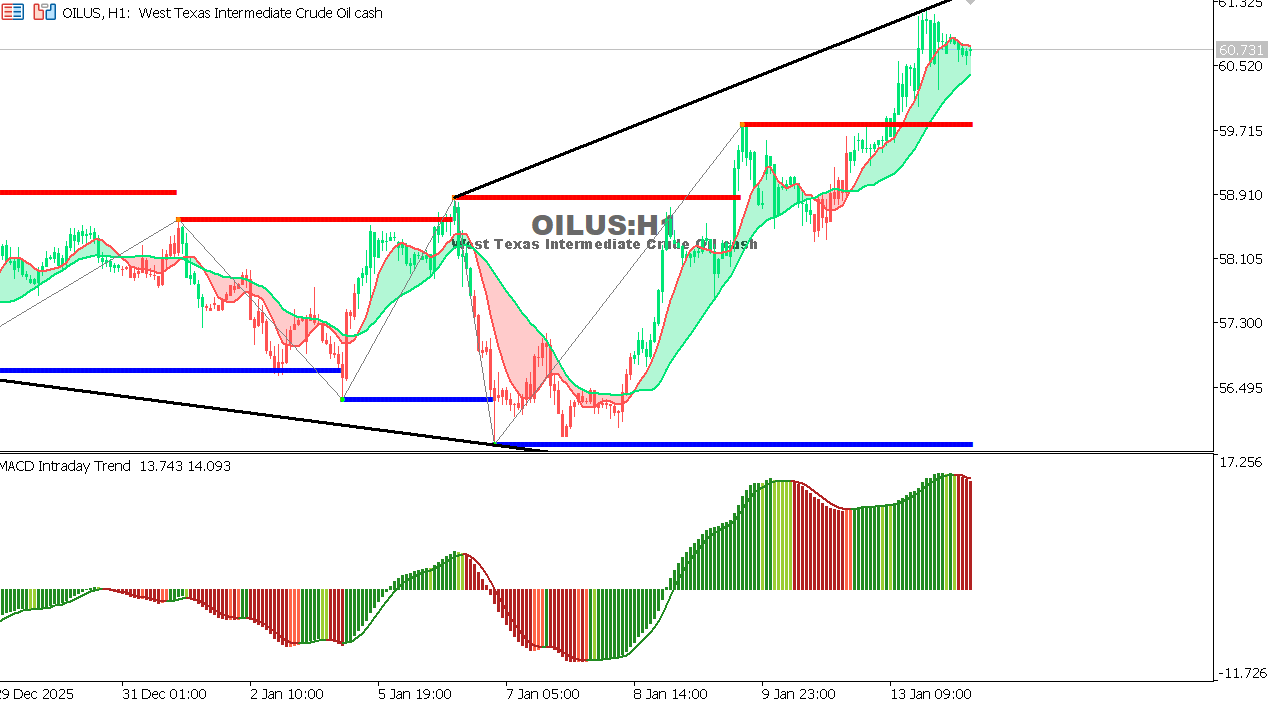 |
USOIL Chart on the hourly time frameOil is moving in a sideways range with a downward bias, with a clear weakening of buying momentum due to concerns about slowing global demand. Trading below the key resistance reflects market caution. General Trend: Neutral with a slight downward bias Expectation: A break below 59.80 could open the way for further declines, while a return above 62.40 would improve the bullish outlook. |
 |
|
|
 |
|
|