FXEM - EMPIRE MARKETS - Company New Article
To access the website's classic version and the new accounts, please click here
Nov 13, 2025
 |
|
|
 |
||
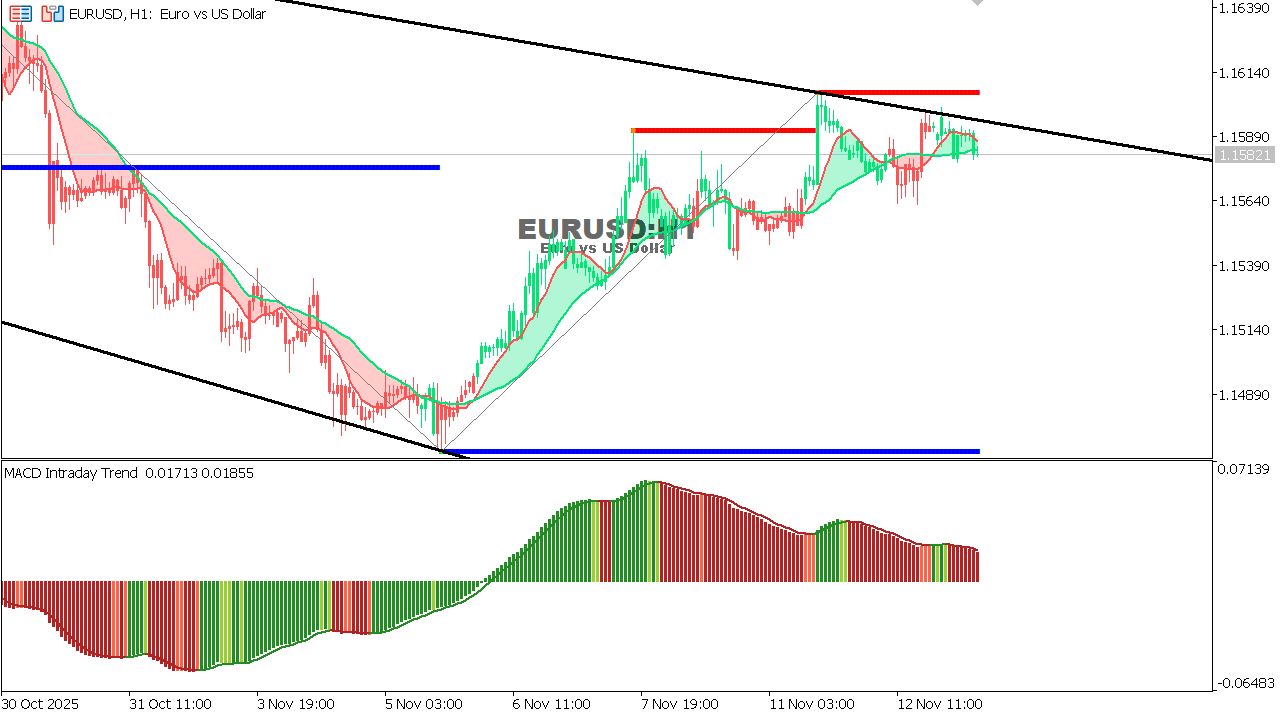
EUR/USD Chart on the hourtly time frameThe pair is trading within a descending channel on the hourly timeframe, showing limited recovery after bouncing off strong support near 1.1510. However, the current move is facing resistance from the upper boundary of the descending channel and the horizontal resistance line at 1.1610. The MACD indicator remains in positive territory, but the upward momentum is gradually weakening, suggesting a potential short-term downward correction. A break above 1.1610 would confirm the channel breakout and open the way towards 1.1650, while failure to break above this level could push the price back towards 1.1530.
Expectation: Continued fluctuation within the channel until a clear breakout occurs.
|