FXEM - EMPIRE MARKETS - Company New Article
To access the website's classic version and the new accounts, please click here
Nov 12, 2025
 |
|
|
 |
||
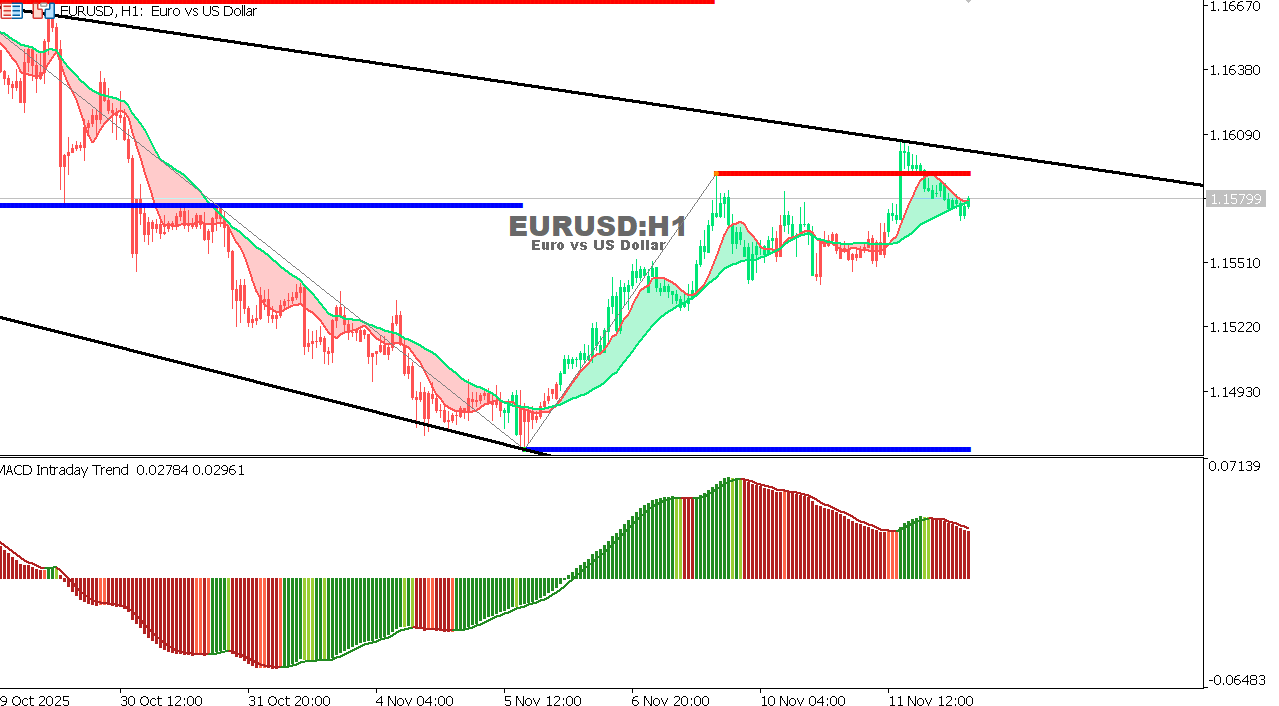
EUR/USD Chart on the hourtly time frameThe pair is showing a notable recovery from the 1.1460 low and is currently trading near 1.1580 within a medium-term descending channel. A slight improvement in risk appetite, coupled with a weakening US dollar, has supported this upward movement. However, prices are facing strong resistance near the upper channel boundary at 1.1610. The MACD indicator remains in positive territory, but momentum is gradually slowing, suggesting a possible minor correction before any new breakout attempt.
Expectation: A clear break above 1.1610 would confirm the bullish move towards 1.1660, while failure to break above this level would send the price back to retest 1.1500.
|