FXEM - EMPIRE MARKETS - Company New Article
To access the website's classic version and the new accounts, please click here
Nov 12, 2025
 |
|
|
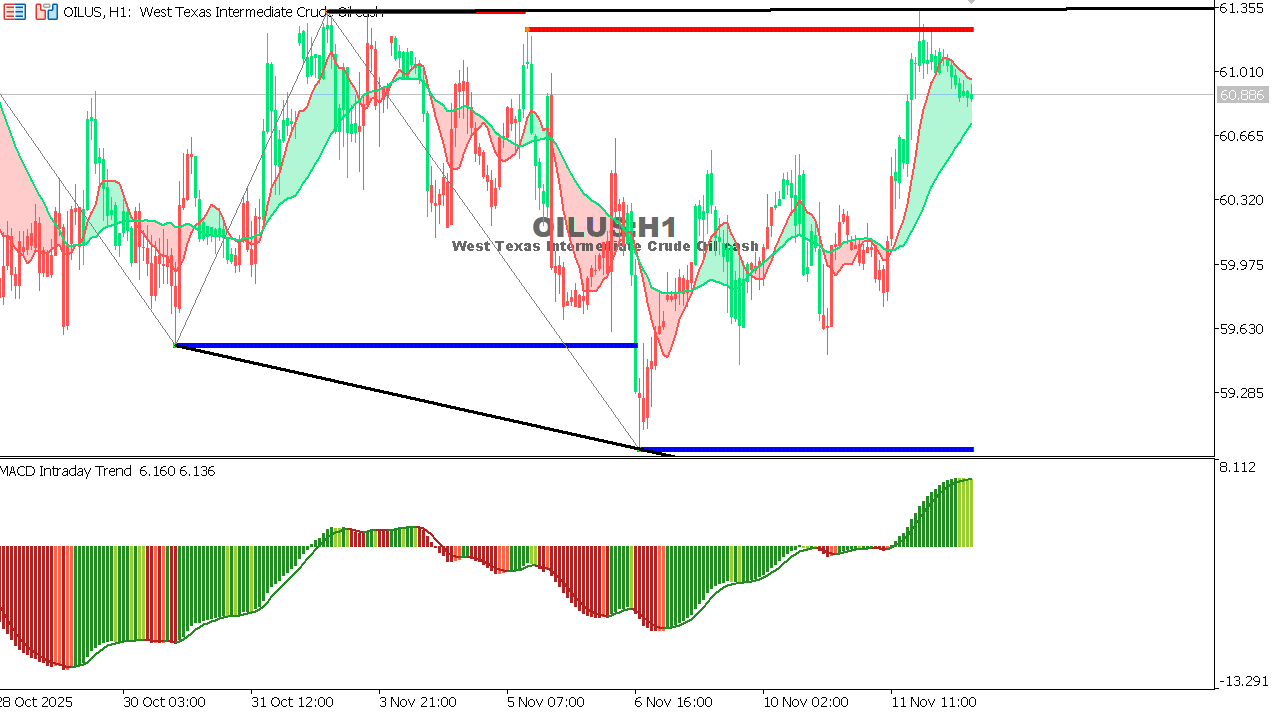 |
USOIL Chart on the hourly time frameOil is currently trading near $60.88 after recovering from the $59.70 low, supported by a slight improvement in risk appetite and a weaker US dollar. Despite this limited rise, prices are still moving within a medium-term descending channel, making the current rally more of a temporary correction. The MACD indicator shows improved momentum but remains below positive territory, suggesting that the overall trend has not yet turned clearly bullish.
Expectation: A break above the 61.30 resistance would confirm the continuation of the correction towards 62.00, while failure to do so could bring back downward pressure towards 59.70 and then 59.00.
|
 |
|
|
 |
|
|