FXEM - EMPIRE MARKETS - Company New Article
To access the website's classic version and the new accounts, please click here
Nov 13, 2025
 |
|
|
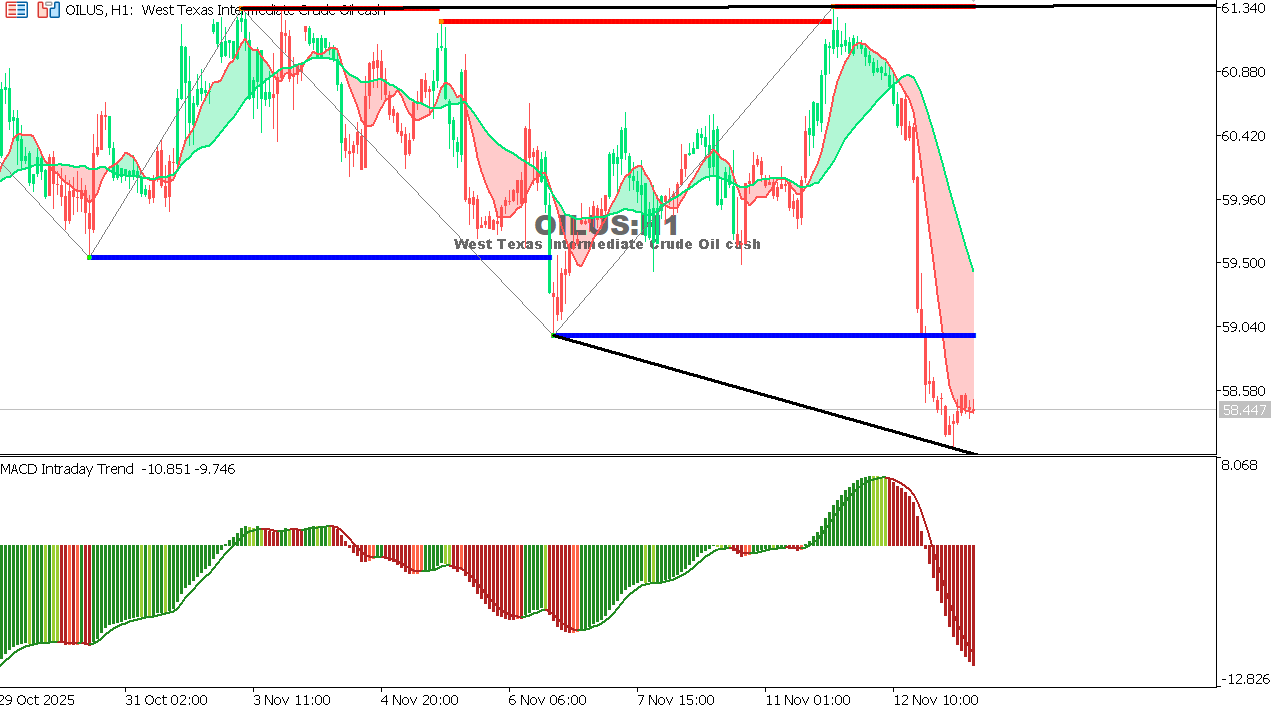 |
USOIL Chart on the hourly time frameOil is moving in a narrow sideways range after a sharp downward wave, attempting to stabilize above 58.00, which represents a key support level. The MACD indicator shows weakening downward momentum, which may signal the start of a limited upward correction. A break above 59.20 would strengthen the likelihood of a recovery towards 60.00, while a break below 57.80 would revive the downtrend towards 56.90.
Expectation: A limited recovery is possible as long as the price holds support at 57.80.
|
 |
|
|
 |
|
|