FXEM - EMPIRE MARKETS - Company New Article
To access the website's classic version and the new accounts, please click here
Nov 11, 2025
 |
|
|
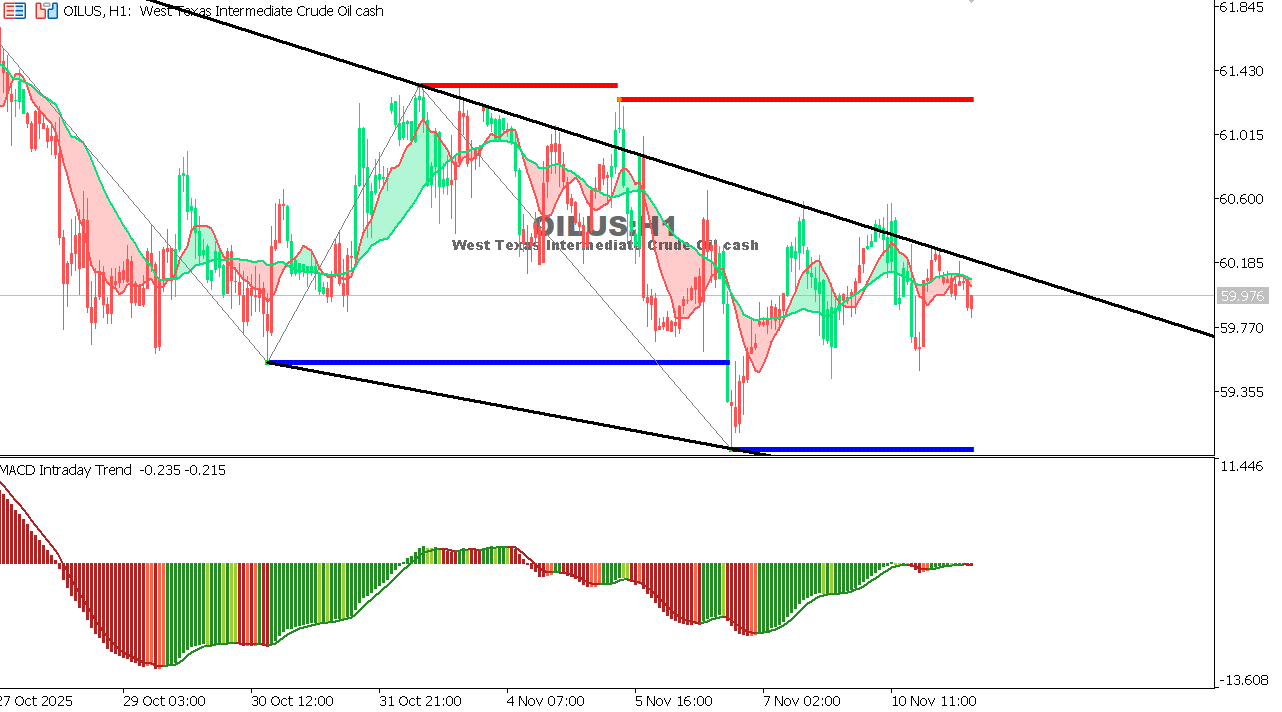 |
USOIL Chart on the hourtly time frameOil is currently trading near $59.79 per barrel after a sharp decline last week. Prices found temporary support around $59.20, while selling pressure remains dominant due to weak global demand and rising US inventories. The MACD indicator is still in negative territory, reflecting the continuation of the short-term downtrend. However, the current consolidation could pave the way for a limited correction towards $61.00.
Expectation: Holding above $59.20 could allow for a limited rebound, while a break below this level would resume the decline towards $58.40.
|
 |
|
|
 |
|
|