FXEM - EMPIRE MARKETS - Company New Article
To access the website's classic version and the new accounts, please click here
Apr 13, 2026
Weekly Technical Analysis Report dated April 13-2026
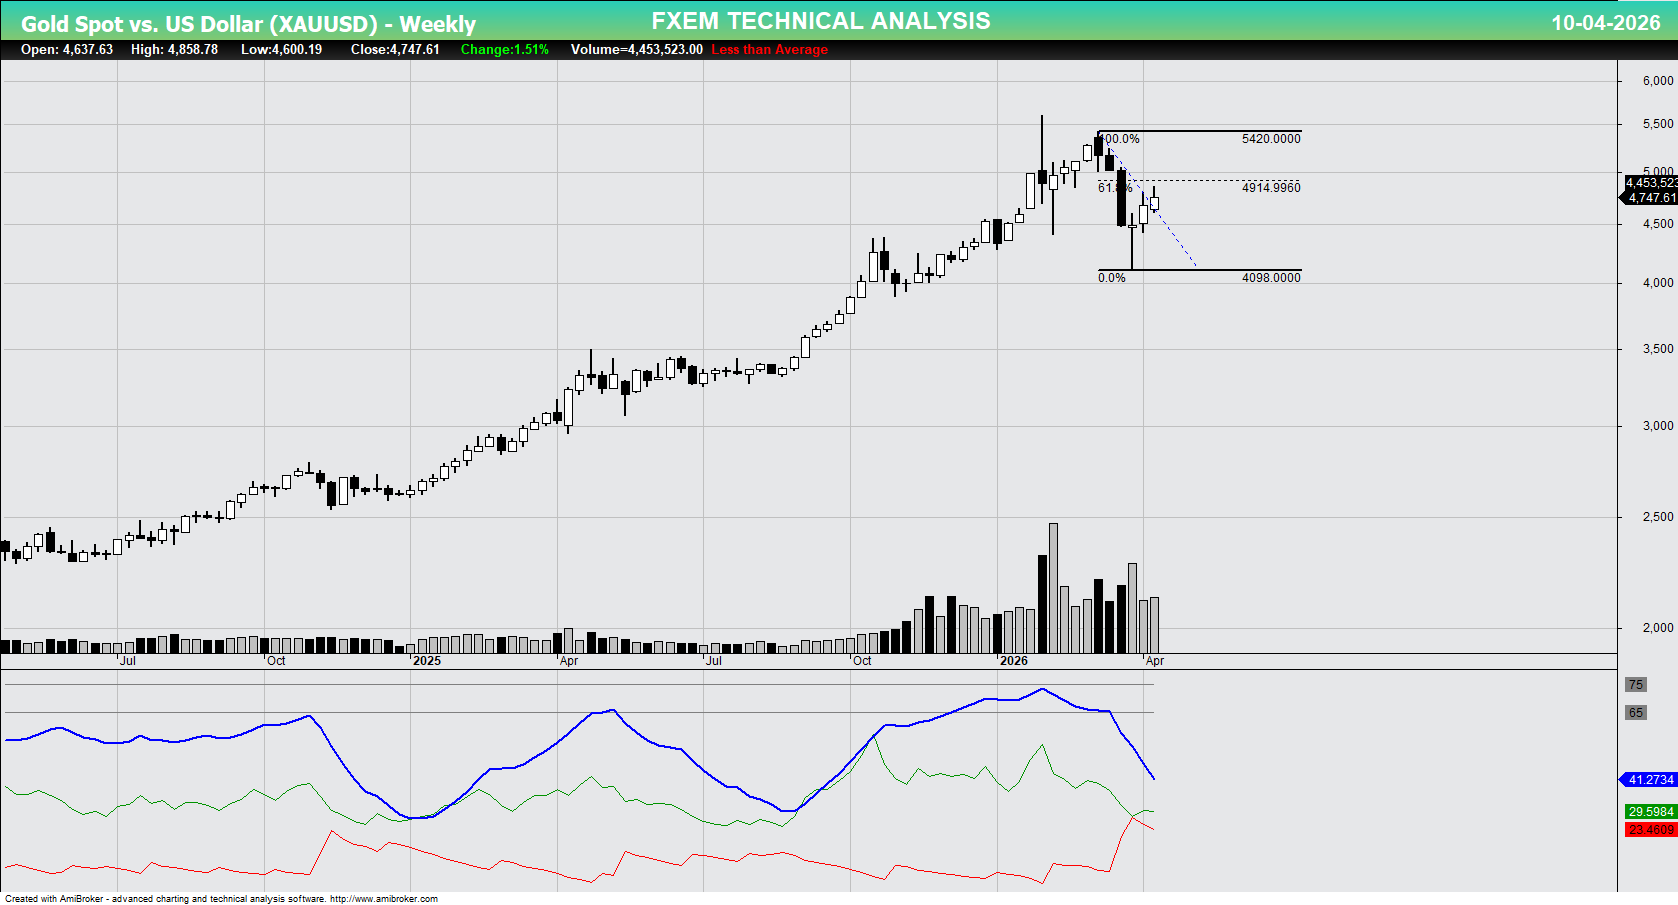
Weekly Technical Analysis of XAUUSD
As anticipated in the previous week’s report, gold extended its rebound for a third consecutive week, reaching the projected target zone between $4,800 and $4,900. The metal recorded an intraday high of $4,858 during the week before encountering selling pressure, which led to a modest pullback and a weekly close at $4,747, reflecting a gain of 1.51%.
Despite this upward movement, the price action may be indicative of a temporary corrective phase—commonly referred to as a “dead cat bounce”—following the prior sharp decline.
Notably, trading volume for the week was below average, suggesting limited buying conviction and insufficient momentum to confirm a sustainable trend reversal at this stage.
In the short term (1–4 weeks), price action is expected to remain range-bound, fluctuating between the $4,350 support level (recent low) and the $4,915 Fibonacci resistance.
Failure to secure a weekly close above $4,915 would maintain a downside bias. From a trading perspective, short-term participants may consider selling into rallies within the $4,800–$4,900 resistance zone, targeting a move back toward $4,400.
Conversely, long positions should be deferred until a confirmed weekly close above $5,050, which would signal the likely completion of the corrective phase and a resumption of bullish momentum.
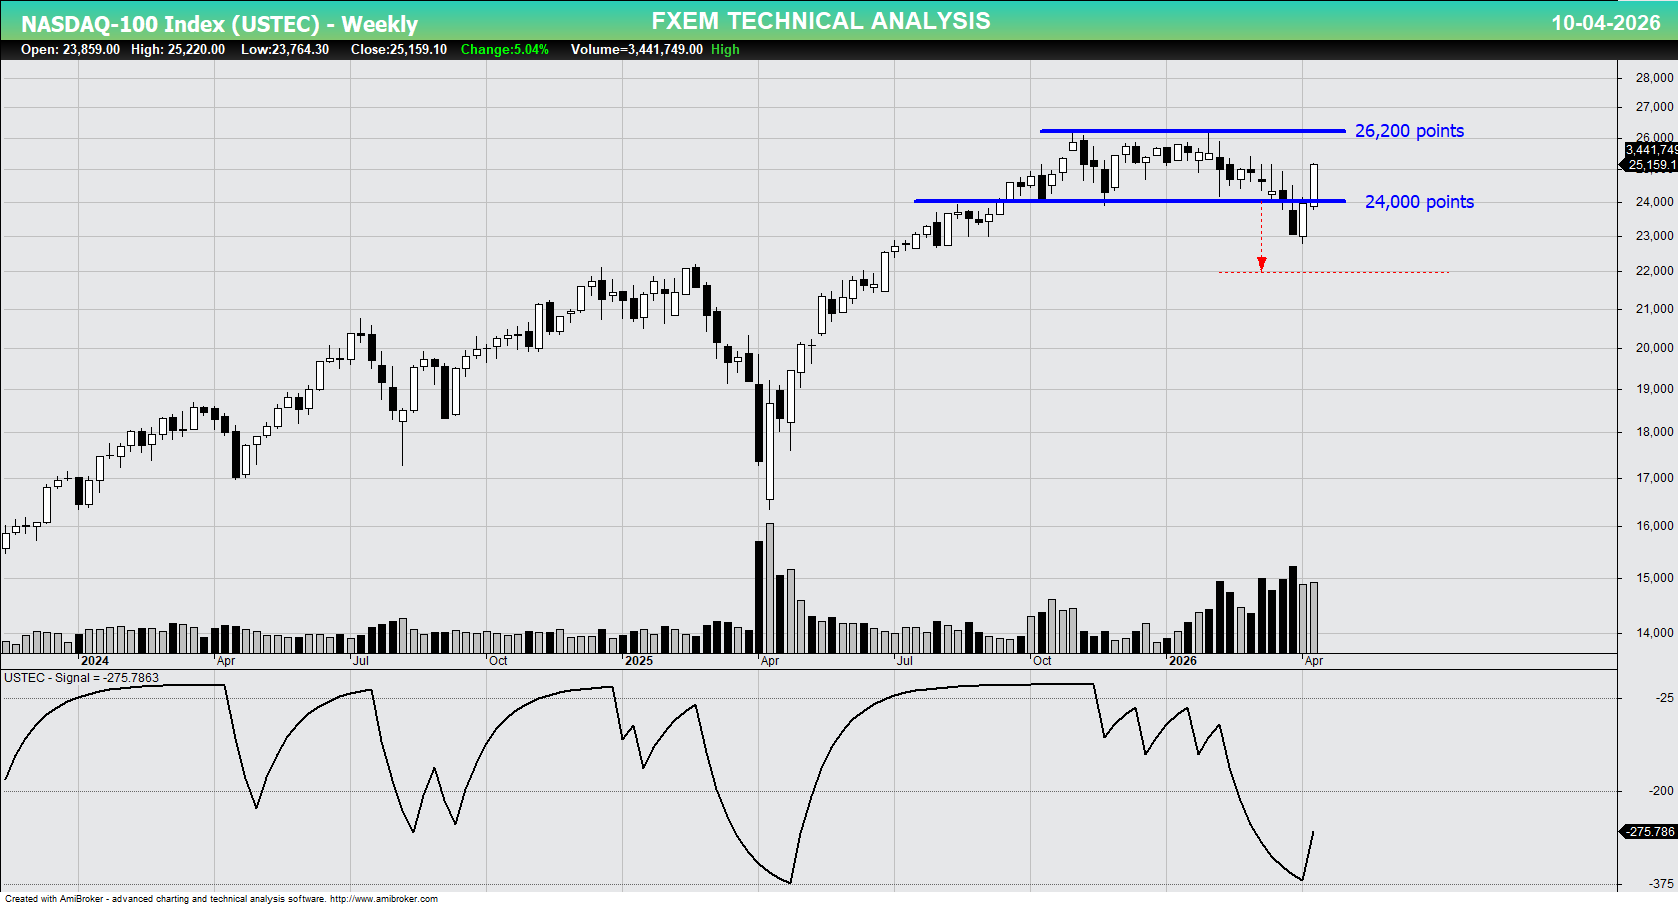
Weekly technical analysis of USTEC
The index concluded the week at 25,159.10, registering a robust gain of 5.04% and forming a large bullish engulfing candlestick on the weekly timeframe. This pattern reflects a strong reversal following a brief breakdown below the key psychological support at 24,000, where prices had previously declined to approximately 22,775 before being rapidly bid higher, effectively creating a classic bear trap.
The recovery was accompanied by elevated trading volume, reinforcing the bullish interpretation and suggesting institutional accumulation near the 24,000 level. Despite this strength, the 26,200 level remains a critical resistance ceiling for the current advance.
The sharp V-shaped rebound from support increases the probability of a near-term retest of this resistance, with momentum indicating that such a move could occur within the next one to three weeks. From a medium-term perspective, a confirmed breakout above 26,200 on strong volume would imply an upside target near 28,500, derived from the prior consolidation range, whereas repeated failure at this level could establish a triple-top formation and trigger a corrective move toward the 22,000 region.
Accordingly, swing traders may consider maintaining long exposure targeting the 26,100 area, with protective stops placed below 23,700, while long-term investors are advised to hold positions given the intact broader uptrend and consider adding exposure only upon a decisive breakout above resistance.
Nonetheless, caution is warranted near 26,200, as this level has historically attracted significant selling pressure, making partial profit-taking prudent.
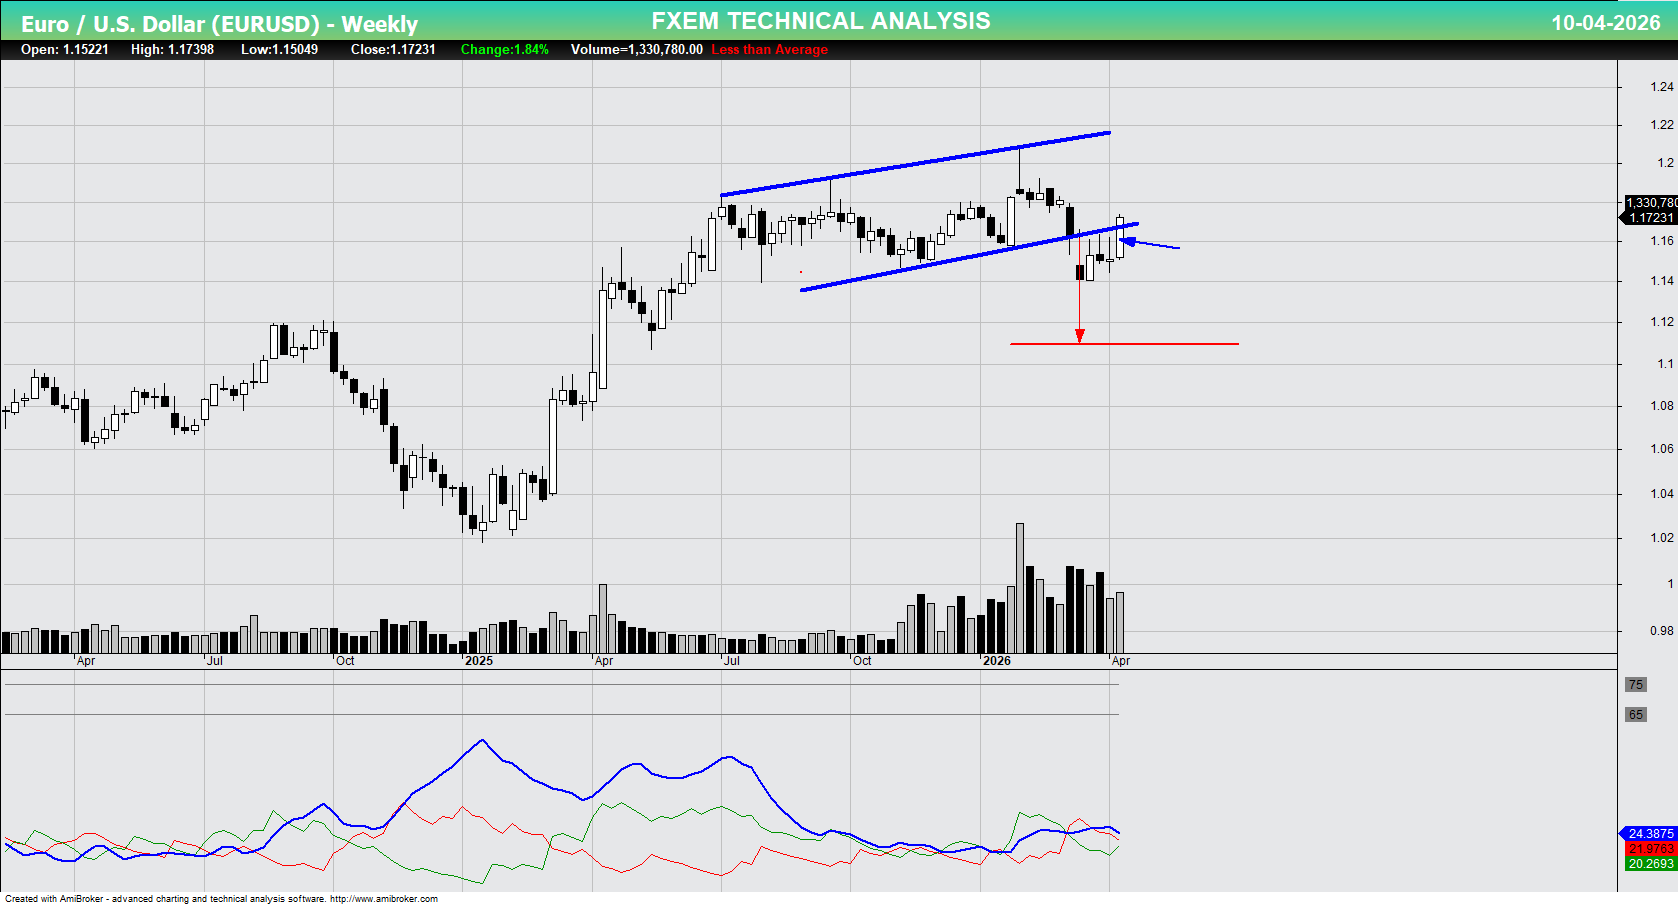
Weekly technical analysis of EURUSD
The current technical outlook for EURUSD presents a decidedly high-risk setup as the pair sits at a critical "make-or-break" juncture following its recent breach of a long-standing ascending channel.
While the move to 1.17231 reflects a short-term recovery, the price is currently bumping against the underside of broken support, a move often characterized as a "dead cat bounce" or a corrective retest before further downside.
This recovery is complicated by the fact that oscillators appear flattened and compressed within lower ranges, suggesting weak directional conviction despite the recent green candle.
The fact that this rally is occurring on less-than-average volume further increases the danger for buyers, as it suggests a lack of institutional conviction and a high probability of a "bull trap." If the Euro cannot decisively reclaim the 1.1730 – 1.1750 resistance zone and move back within its former trend lines, the technical breakdown will be validated, potentially accelerating a bearish slide toward the major psychological floor at 1.1100.
Consequently, this is an exceptionally high-risk environment where traders should remain defensive, as the failure to clear immediate overhead resistance could lead to a rapid increase in selling pressure.
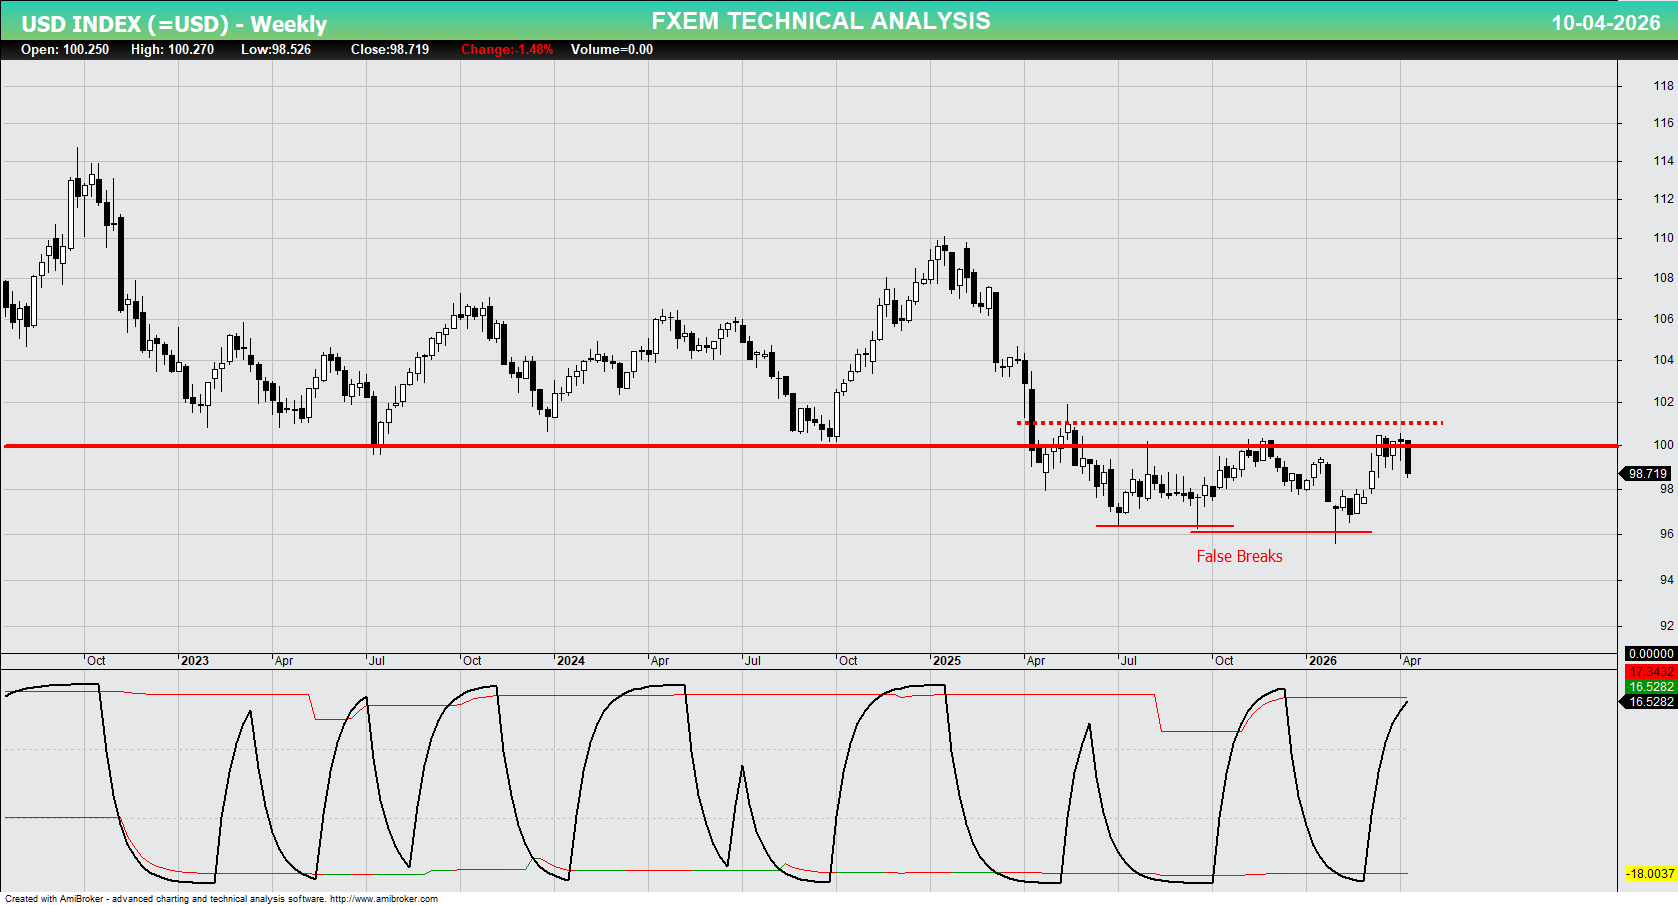
Weekly technical analysis of USD Index
The weekly technical outlook for the US Dollar Index reflects a market currently defined by a persistent struggle to overcome the significant psychological and structural barrier at the 100.00 level.
Although the index has made several concerted efforts to establish a foothold above this round number since mid-2025, it has consistently faced aggressive selling pressure, leading to the repeated rejections visible at the resistance line.
The recent weekly close at 98.719, representing a -1.48% decline, underscores a lack of bullish follow-through and suggests that the 100.00 mark remains a formidable "ceiling" for the time being.
This structural resistance is further reinforced by the momentum oscillators in the lower panel, which are currently showing signs of exhaustion and a downward turn after failing to maintain elevated levels.
Until the index can produce a decisive weekly close above the 100.00–101.00 zone, the USD remains locked in a range-bound environment with a slightly bearish tilt.
Investors should keep a close eye on the support floor near 96.00, as the index appears to be entering a renewed phase of consolidation while the market awaits a clearer fundamental or technical catalyst to break this current deadlock.