FXEM - EMPIRE MARKETS - Company New Article
To access the website's classic version and the new accounts, please click here
Apr 13, 2026
Technical analysis of some commodities pairs:
Technical Analysis Report (April 13, 2026):
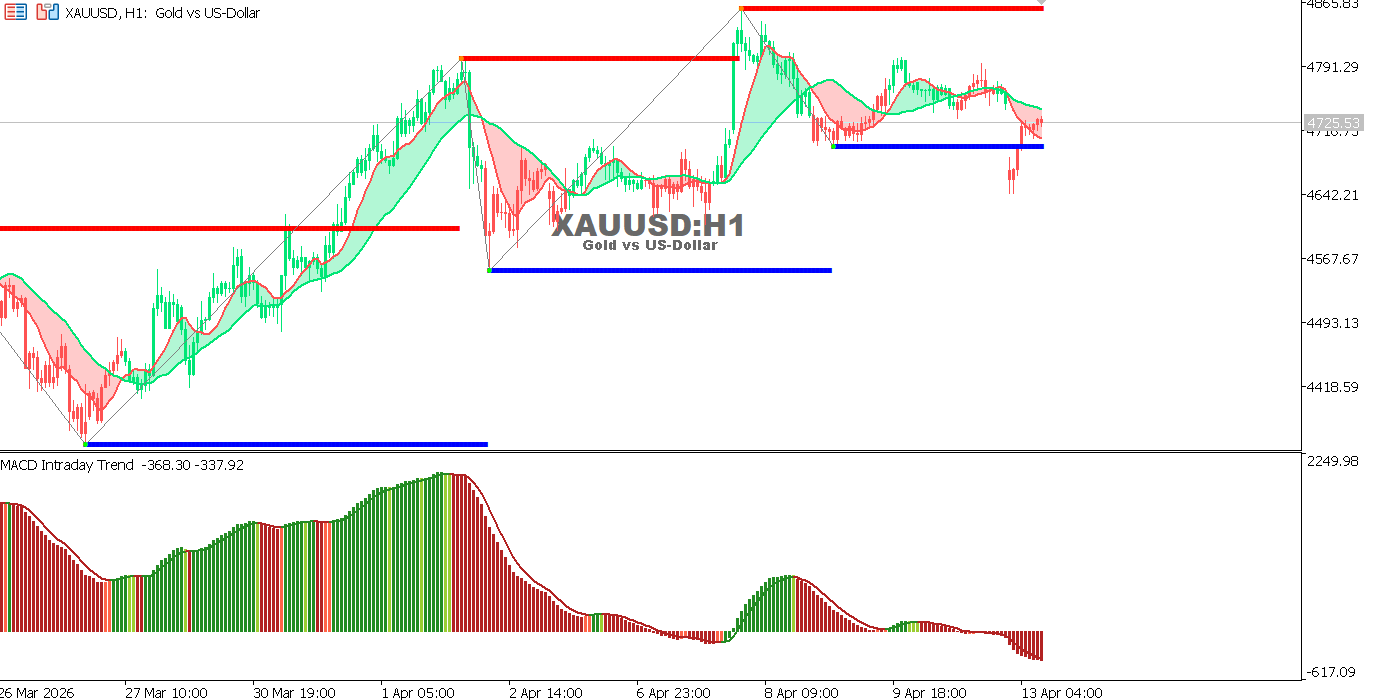
XAUUSD Hourly Chart
Gold is trading near 4725 after a noticeable pullback from recent highs, testing key support levels.
Momentum is turning negative in the short term, indicating ongoing corrective pressure.
- Trend: Bullish (bearish correction)
- Support: 4715 – 4655
- Resistance: 4790 – 4865
Outlook: Holding above 4715 may support recovery, while a break below could push prices toward 4655.
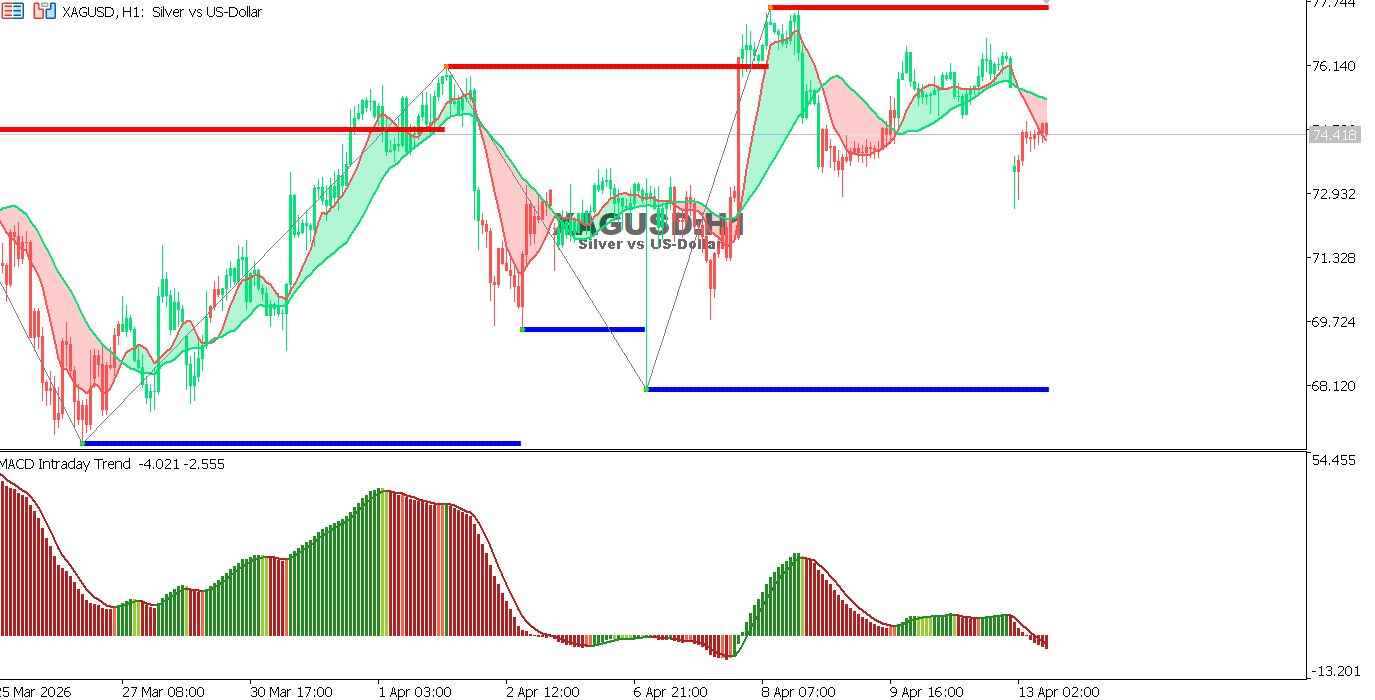
XAGUSD Hourly Chart
Silver is trading near 74.40 after pulling back from the recent high at 77.70, with relative stability above support levels.
Momentum is slightly negative, suggesting a possible continuation of the correction before resuming the uptrend.
- Trend: Bullish (bearish correction)
- Support: 72.90 – 71.30
- Resistance: 76.10 – 77.70
Outlook: Holding above 72.90 supports recovery, while a break below may extend the downside.
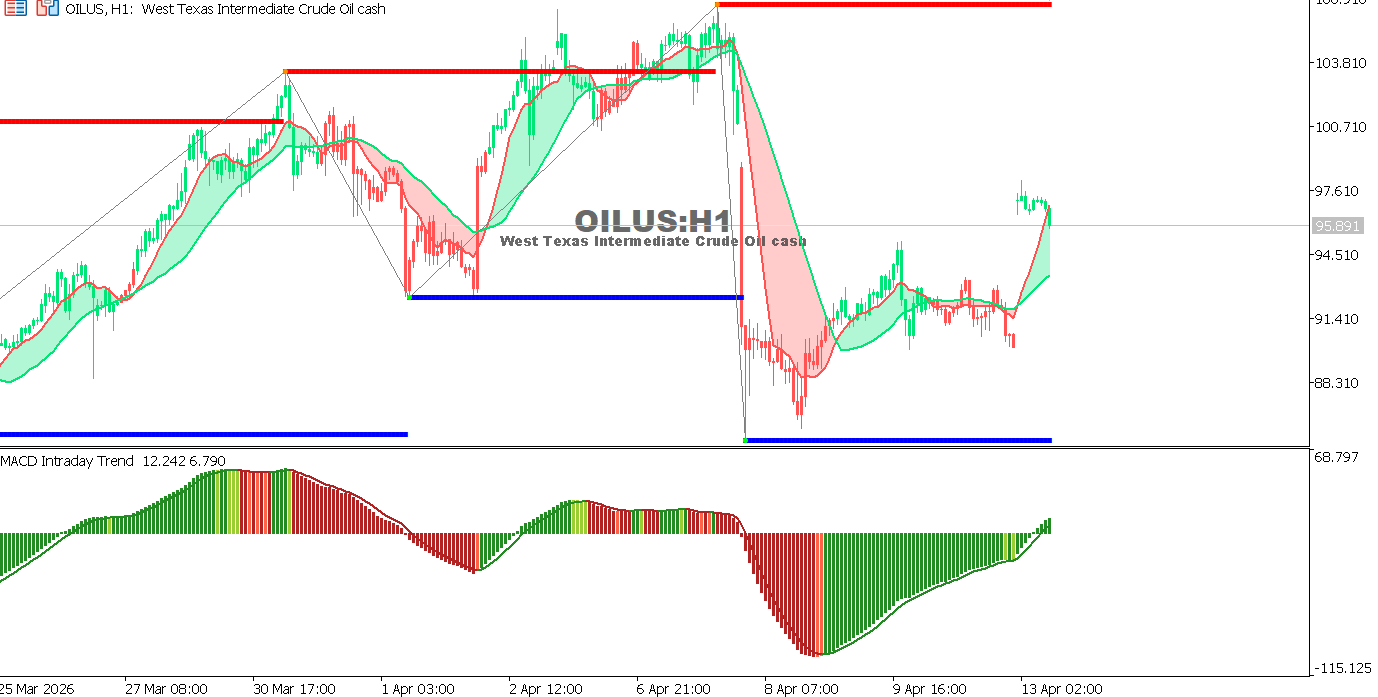
USOIL Hourly Chart
Oil is trading near 95.80 after a strong recovery from 88.30, attempting to stabilize above 95.00.
Momentum is currently positive, supporting continued upside in the short term.
- Trend: Bullish
- Support: 94.50 – 91.40
- Resistance: 97.60 – 100.70
Outlook: Holding above 94.50 supports further gains, while a break below may bring back selling pressure.
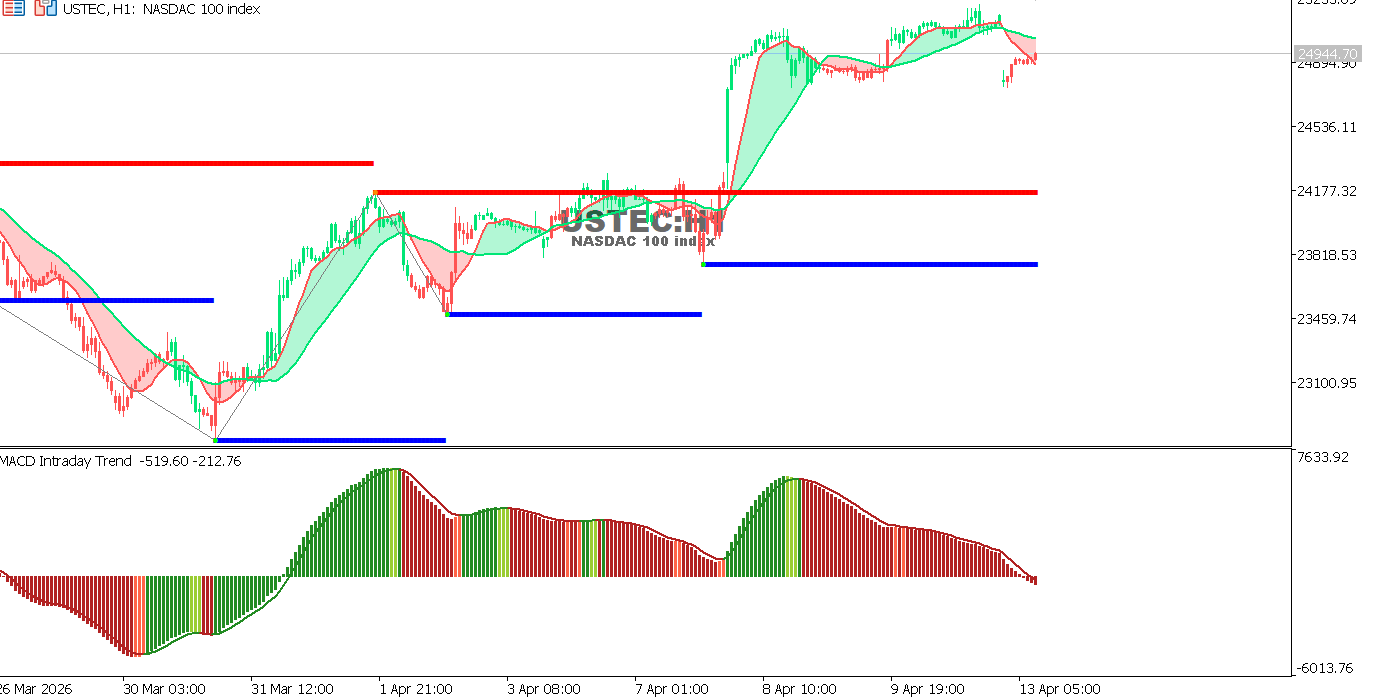
USTEC Hourly Chart
The index is trading near 24940 after a limited pullback from recent highs, still holding above key support levels.
Momentum is easing but remains positive, supporting the continuation of the uptrend.
- Trend: Bullish
- Support: 24530 – 23800
- Resistance: 25150 – 25350
Outlook: Holding above 24530 supports further upside, while a break below may lead to a deeper correction.
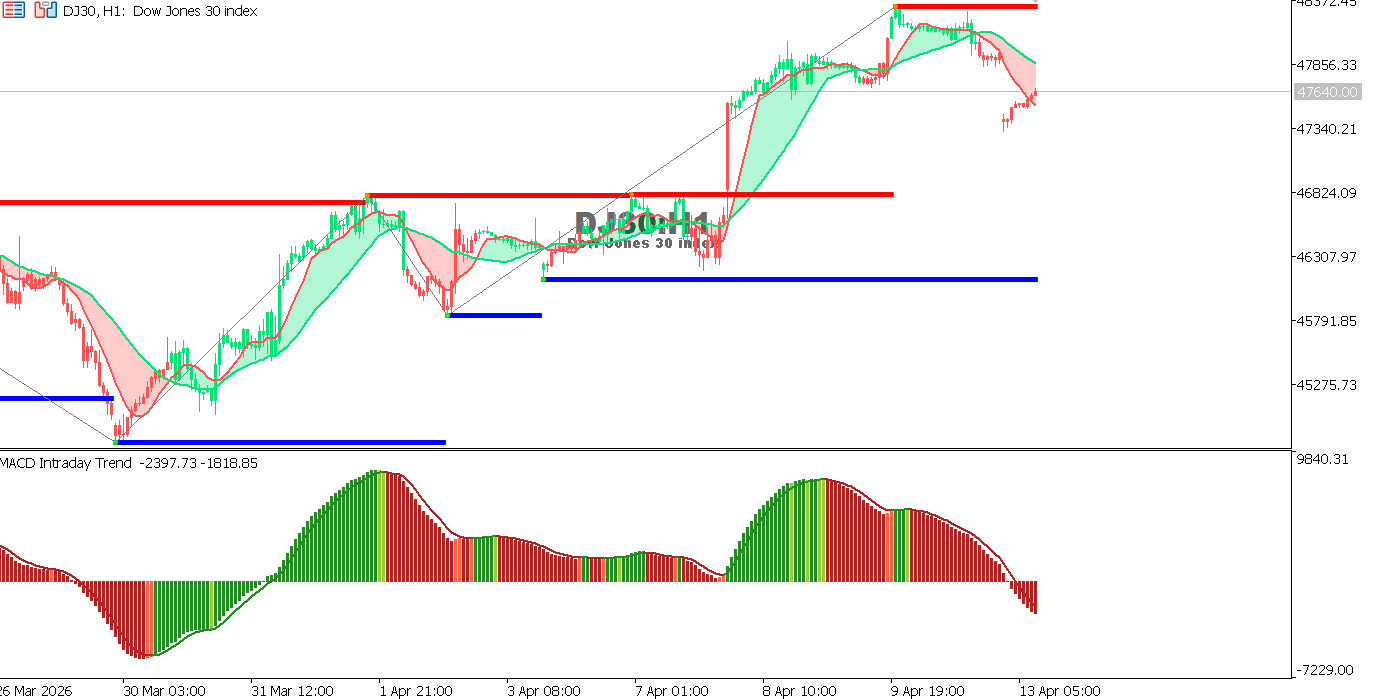
US30 Hourly Chart
The index is trading near 47640 after pulling back from the recent high at 48350, with short-term selling pressure emerging.
Momentum is turning negative, indicating a potential continuation of the correction before any new upside attempt.
- Trend: Bullish (bearish correction)
- Support: 47350 – 46850
- Resistance: 48000 – 48350
Outlook: Staying below 48000 supports further downside, while a breakout may revive bullish momentum.