FXEM - EMPIRE MARKETS - Company New Article
To access the website's classic version and the new accounts, please click here
Apr 14, 2026
Technical analysis of some currency pairs:
Technical Analysis Report (April 14, 2026):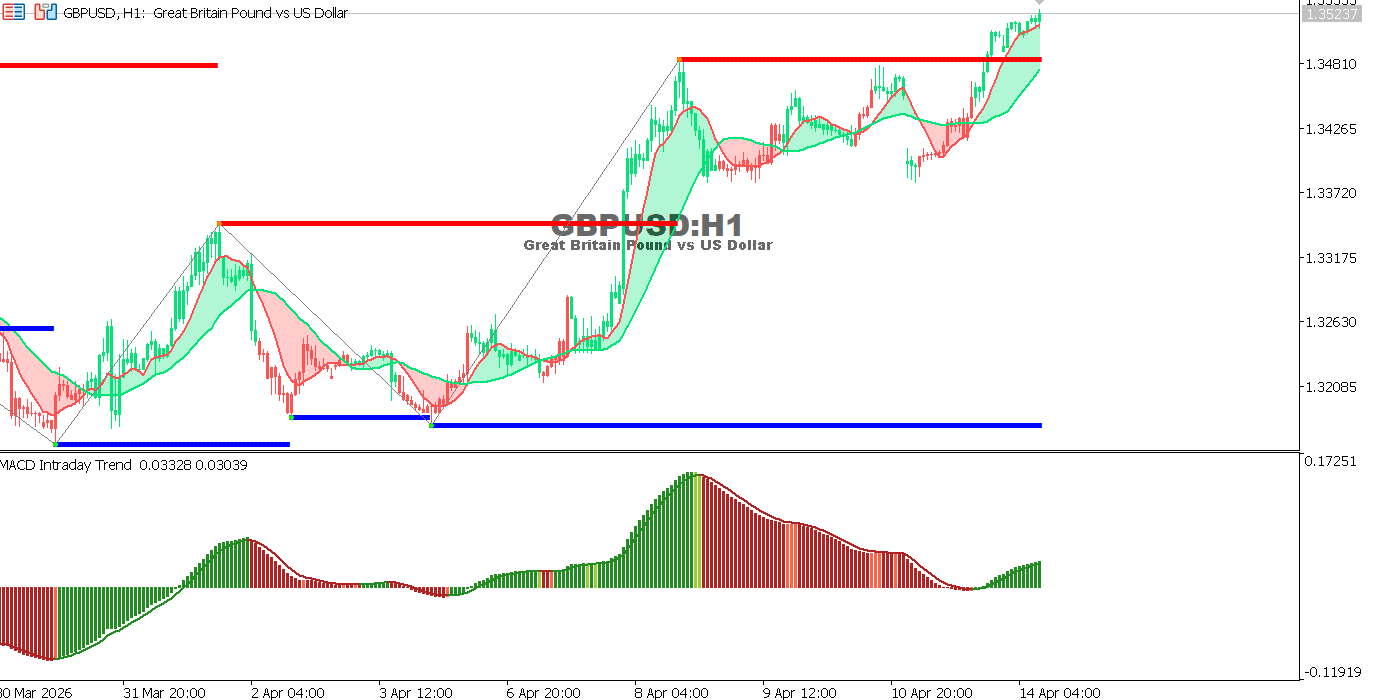
GBPUSD chart on the hourly timeframe
The pair is trading near 1.3523 after a clear breakout above a key resistance level, maintaining higher highs that support the bullish trend.
- Trend: Bullish
- Support: 1.3480 – 1.3420
- Resistance: 1.3550 – 1.3600
Outlook:
Holding above 1.3480 supports further upside toward 1.3550 and 1.3600, while a break below may lead to a limited correction.
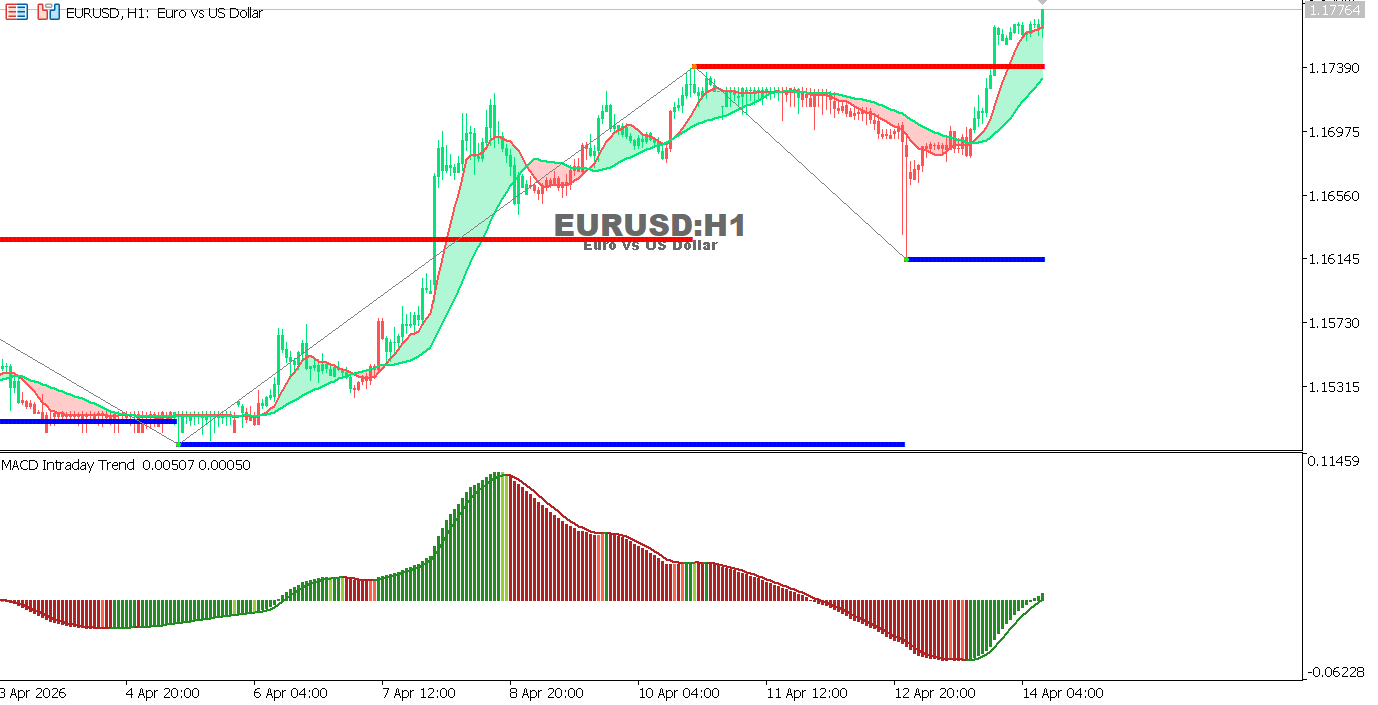
EURUSD chart on the hourly timeframe
The pair is trading near 1.1776 after a strong recovery from recent declines, approaching key resistance levels.
- Trend: Short-term bullish
- Support: 1.1720 – 1.1670
- Resistance: 1.1800 – 1.1850
Outlook:
Stability above 1.1720 supports continued upside, while failure to break 1.1800 may trigger a temporary pullback.
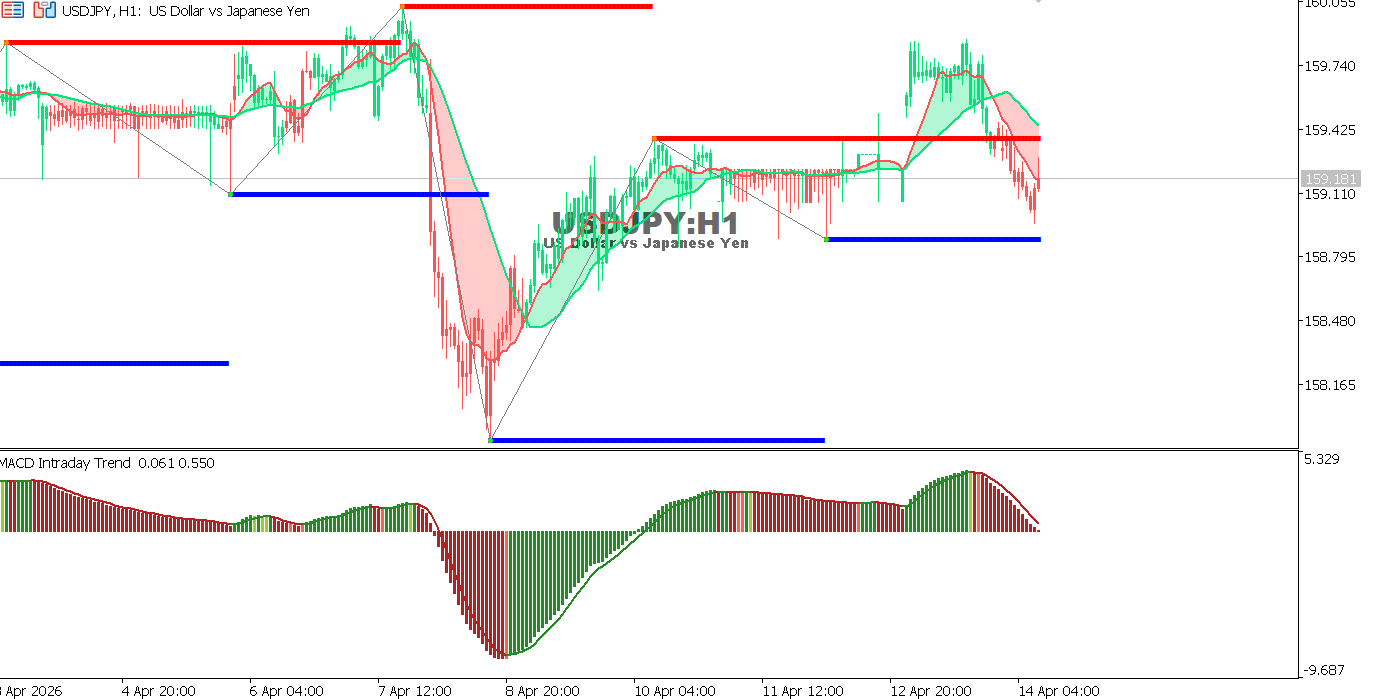
USDJPY chart on the hourly timeframe
The pair is trading near 159.18 after failing to hold above resistance, with signs of weakening momentum.
- Trend: Sideways to bearish
- Support: 158.80 – 158.20
- Resistance: 159.50 – 160.00
Outlook:
A break below 158.80 may lead to further downside, while a move back above 159.50 could restore the bullish trend.