FXEM - EMPIRE MARKETS - Company New Article
To access the website's classic version and the new accounts, please click here
Apr 07, 2026
US oil rises amid tensions: Will the uptrend continue?
Price moves supported by geopolitical risks and expected volatility
|
At the beginning of April, global financial markets showed mixed performance. Precious metals, led by gold and silver, continued to gain supported by a weaker dollar and increased demand for safe-haven assets. In contrast, oil prices showed notable weakness due to concerns over slowing global demand. Stock markets maintained their upward trend, supported by investor optimism regarding stable monetary policies and improving macroeconomic indicators in several major economies. Investors are closely watching upcoming economic data releases that could shape market direction in the short term. |
 |
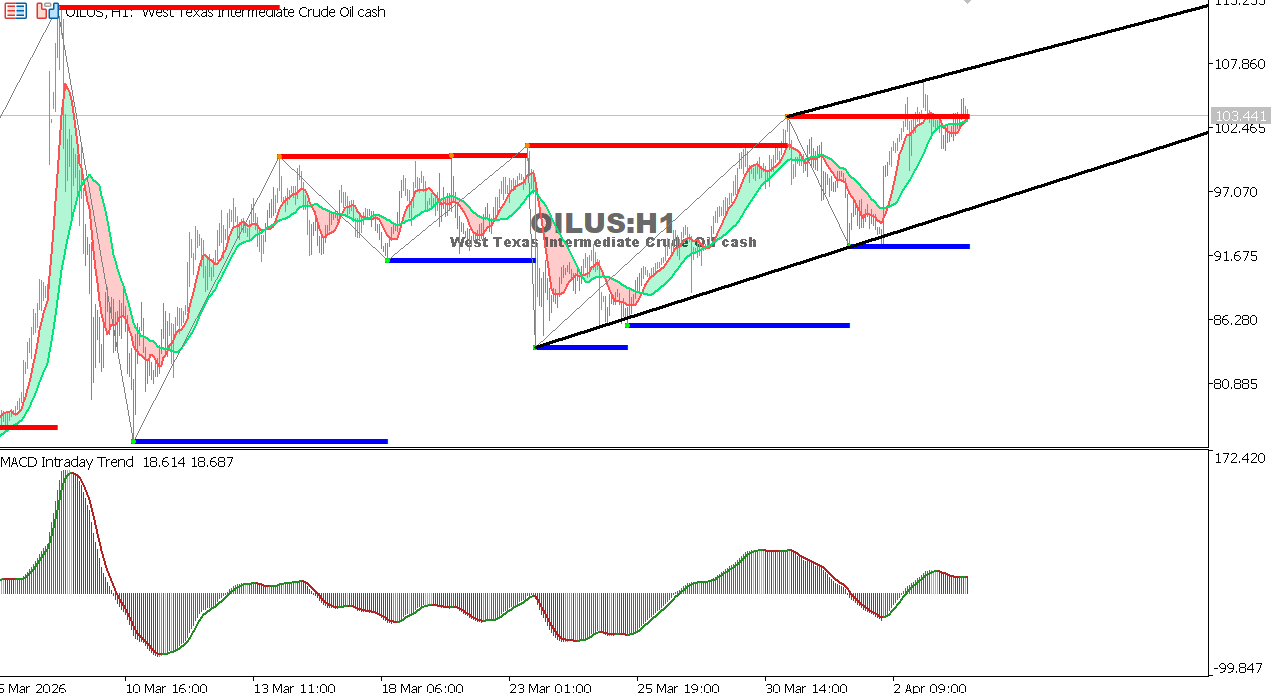
USOIL chart H1 timeframe
US oil (West Texas Intermediate) continues to move within a clear ascending channel on the timeframe, reflecting the dominance of the medium-term positive trend.
- Overall Trend: Upward within a price channel
- Current Price: Near $103
Support Levels:
- First Support: $97.00 (Channel bottom)
- Second Support: $91.50
- Strong Support: $86.00
Resistance Levels:
- Current Resistance: $103.50 (Retest zone)
- Next Resistance: $107.80 (Upper channel boundary) Technical Analysis:
- The price is attempting to establish itself above a previous resistance that has now become support, which is a positive signal.
The rising highs and lows confirm the continuation of the upward trend.
The price is near the upper channel boundary, which may cause a slowdown or a temporary correction before the upward movement resumes.
Technical Indicators:
MACD: Shows a slowdown in upward momentum (convergence of lines), indicating the possibility of sideways movement or a minor correction. Moving averages (from the chart): Still support the upward trend.
Expected scenarios:
Positive scenario:
A clear break above 103.50 targets 107.80 and then higher levels within the channel.
Negative scenario (correction):
A break below 97.00 leads to a decline towards 91.50, and a break below that could push the price down to 86.00.