FXEM - EMPIRE MARKETS - Company New Article
To access the website's classic version and the new accounts, please click here
Sep 15, 2025
 |
|
|
 |
||
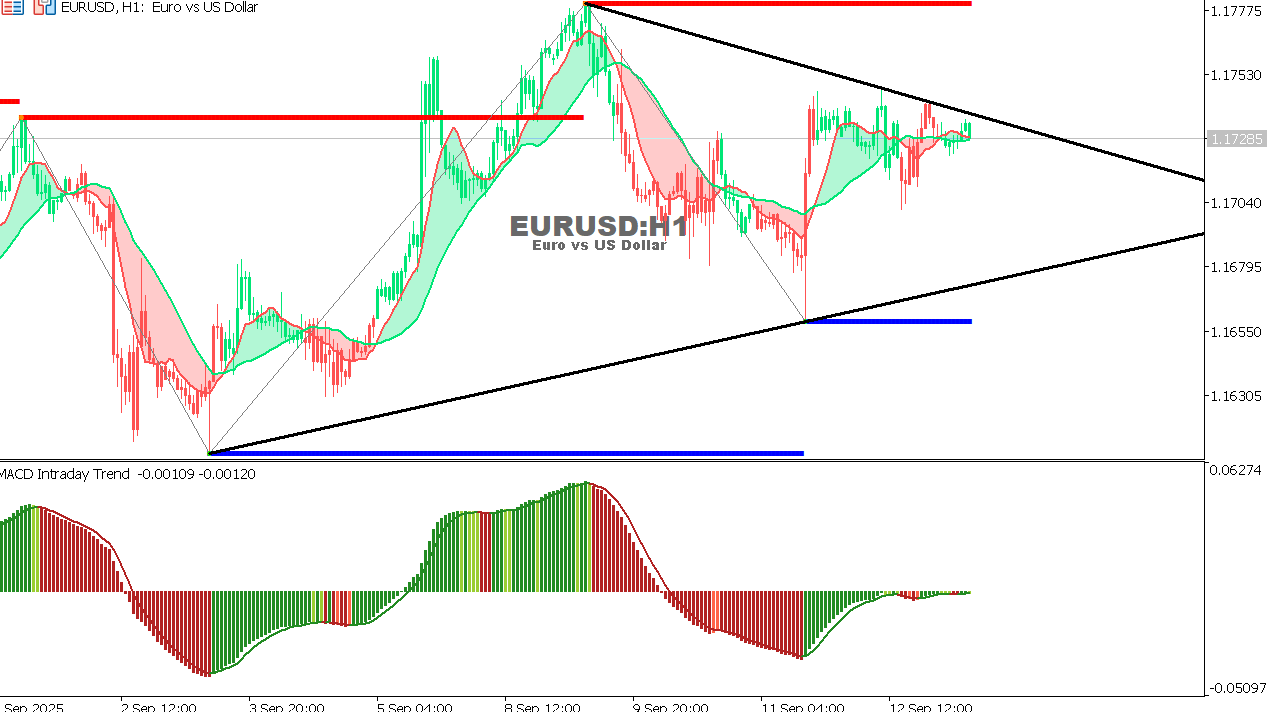
EUR/USD Chart on the hourtly time frameChart Pattern: Symmetrical Triangle. Trend: Sideways; price near the upper boundary. Key Levels:
MACD: Weak bullish crossover; momentum is still limited. Technical Outlook:
|
|
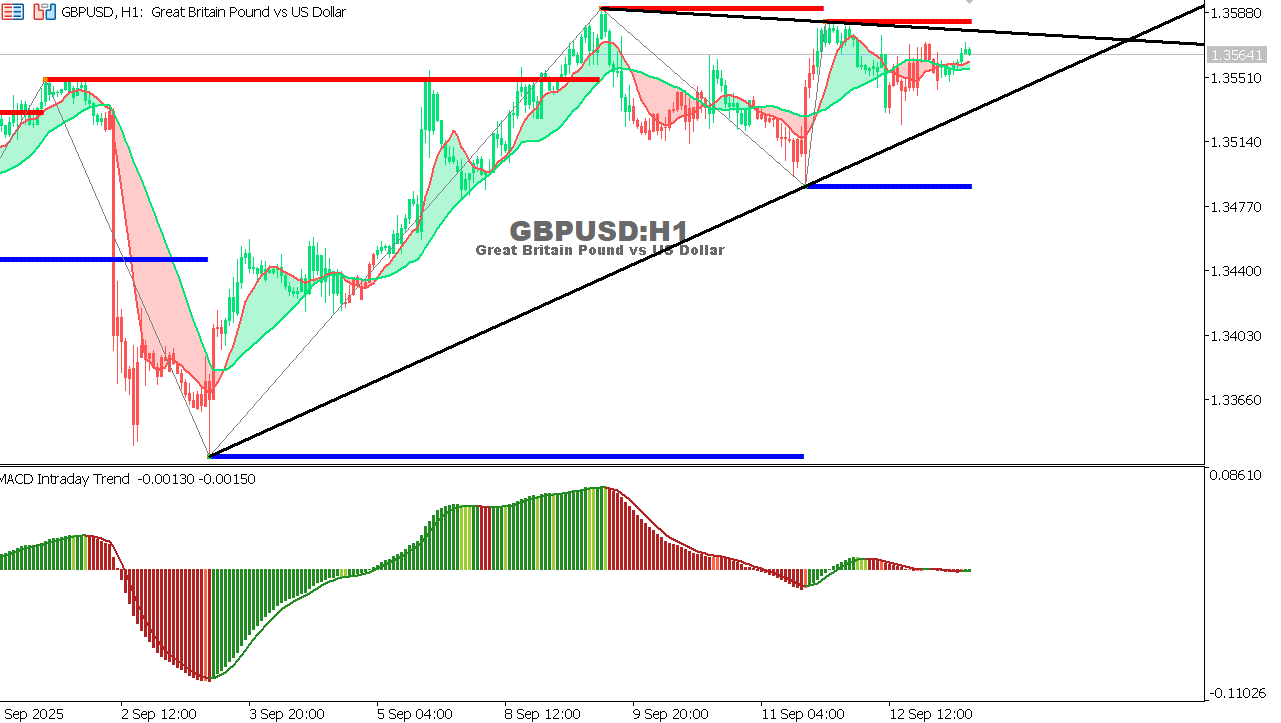
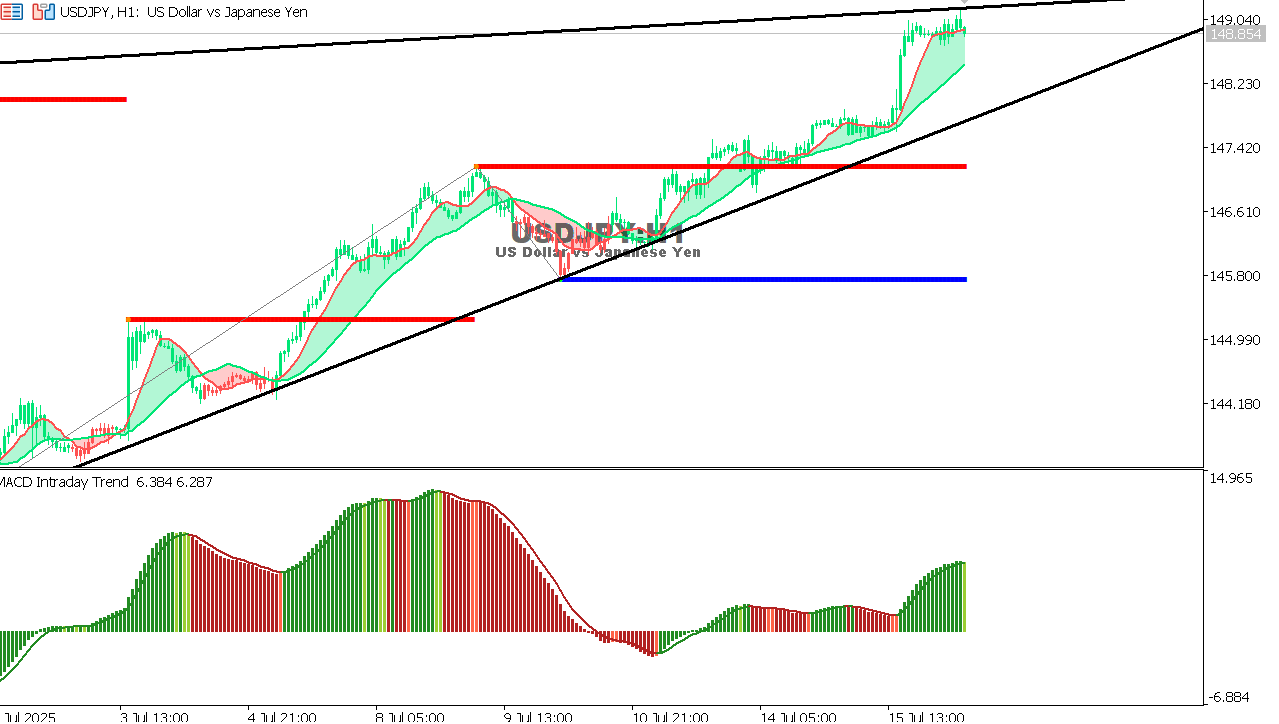
- A look at the report from the past week dated September 12, 2025. |