FXEM - EMPIRE MARKETS - Company New Article

To access the website's classic version and the new accounts, please click here

Jun 17, 2025
GBP/USD chart on the hourly time frame

GBP/USD chart on the hourly time frame

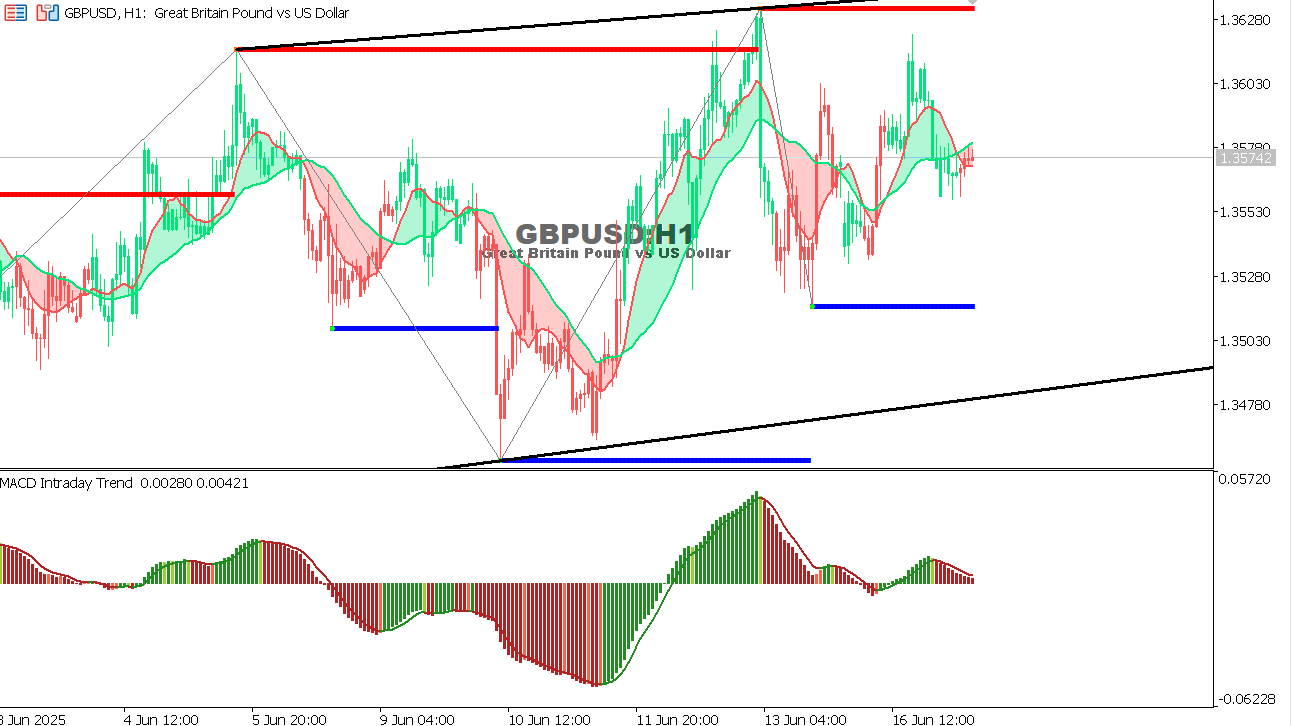
As we mentioned yesterday, if the price holds at 1.3480, we may witness a rise to the 1.3600 level. Indeed, the target has been achieved, and the GBP/USD pair continues to move within a symmetrical triangle pattern, with horizontal resistance at 1.3620 and a rising bottom indicating gradual buying pressure.

  • Current support: 1.3520 – 1.3500
  •  Resistance: 1.3600 – 1.3620
  •  MACD indicator: Shows a slowdown in positive momentum and is leaning towards a negative turn.

Expectations:

  • If the support level of 1.3520 is broken, we may witness further declines towards 1.3480. However, if the price manages to break the resistance level of 1.3620, it may head towards the 1.3660 and 1.3700 levels, respectively.

EUR/USD Chart on the hourtly time frame

EUR/USD Chart on the hourtly time frame

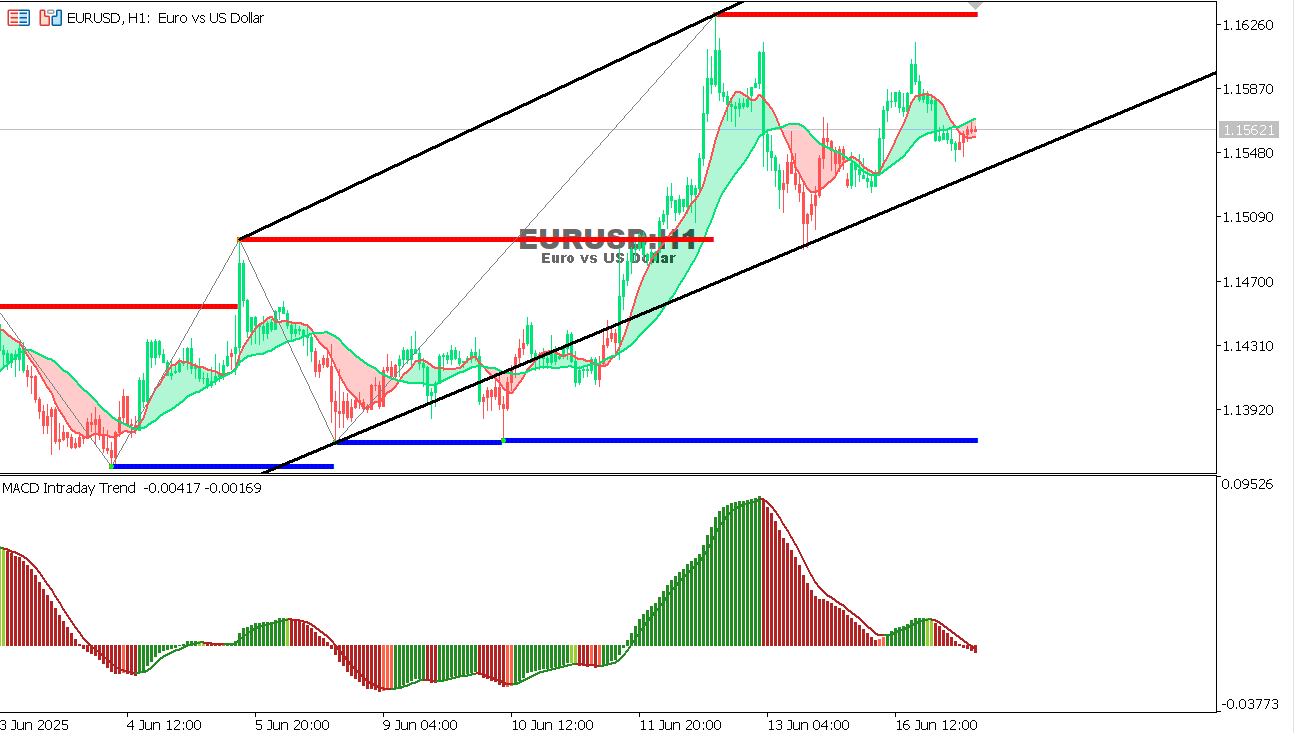
As we predicted yesterday, there is a potential rebound from 1.1500 towards 1.1580 - 1.1600. The targets have indeed been achieved, and the pair is trading within a clear ascending channel and is currently approaching a strong resistance area at 1.1620, with signs of weakness in the upward momentum.

  • Current support: 1.1500 - 1.1430
  • Resistance: 1.1600 - 1.1620
  • MACD indicator: Negative, supporting a bearish correction scenario.

Expectations:

  • If the ascending trend line is broken, the pair may see a correction towards 1.1500 and then 1.1430.
  • However, if it remains above 1.1550, the possibility of a retest of the 1.1600 resistance level remains.
USD/JPY chart on the hourly time frame

USD/JPY chart on the hourly time frame

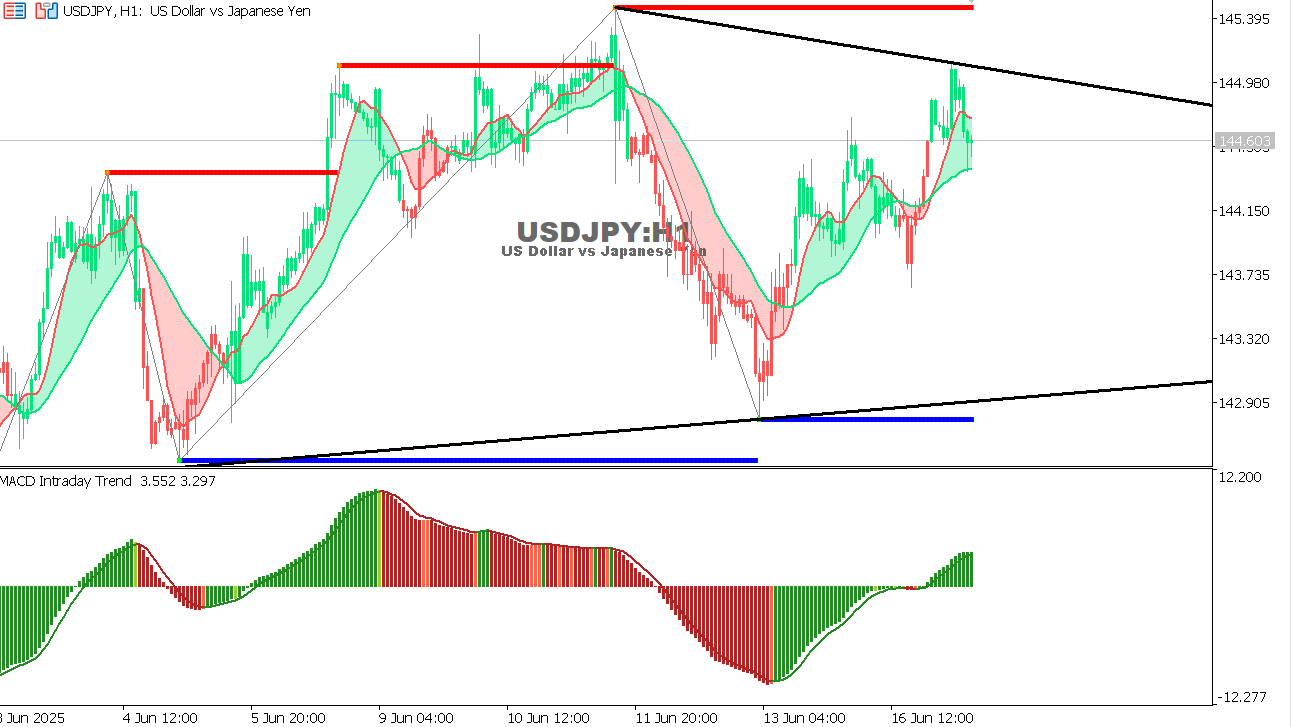
As we mentioned yesterday, the pair has been moving within a symmetrical triangle on the H1 timeframe, with continued fluctuations between its upper and lower boundaries:

  • The current price is around 144.60.
  • The recent high has failed to surpass the previous highs (a negative divergence on the MACD), increasing the possibility of a correction.
  • The triangle is pressing the price towards the end of a nearby pattern, indicating the possibility of an imminent breakout.

Expectation:

  • As long as the price remains below the upper boundary of the triangle (around 145.00), the downside potential remains.
  • A break of the lower boundary of the triangle (below 143.00) may open the way to: 142.80 - 142.30 - 141.70
  • If 145.00 is broken and holds above, we may see: 145.50 - 146.20 - 146.90


To open Live account click here 

One Trading Account | 50+ Forex Pairs | 80+ Trading Instruments
Multi-Asset Trading Platforms

Cookie Policy
This website uses cookies to ensure you get the best experience on our website. We use cookies for proper website navigation and function and for statistical and analytical purposes. You can select the cookie categories that you would like to manage through the Cookies Settings at any time. Please configure your Cookies Settings before proceeding. To learn more, please read our Cookies Policy