FXEM - EMPIRE MARKETS - Company New Article
To access the website's classic version and the new accounts, please click here
Jun 17, 2025
 |
|
|
 |
||
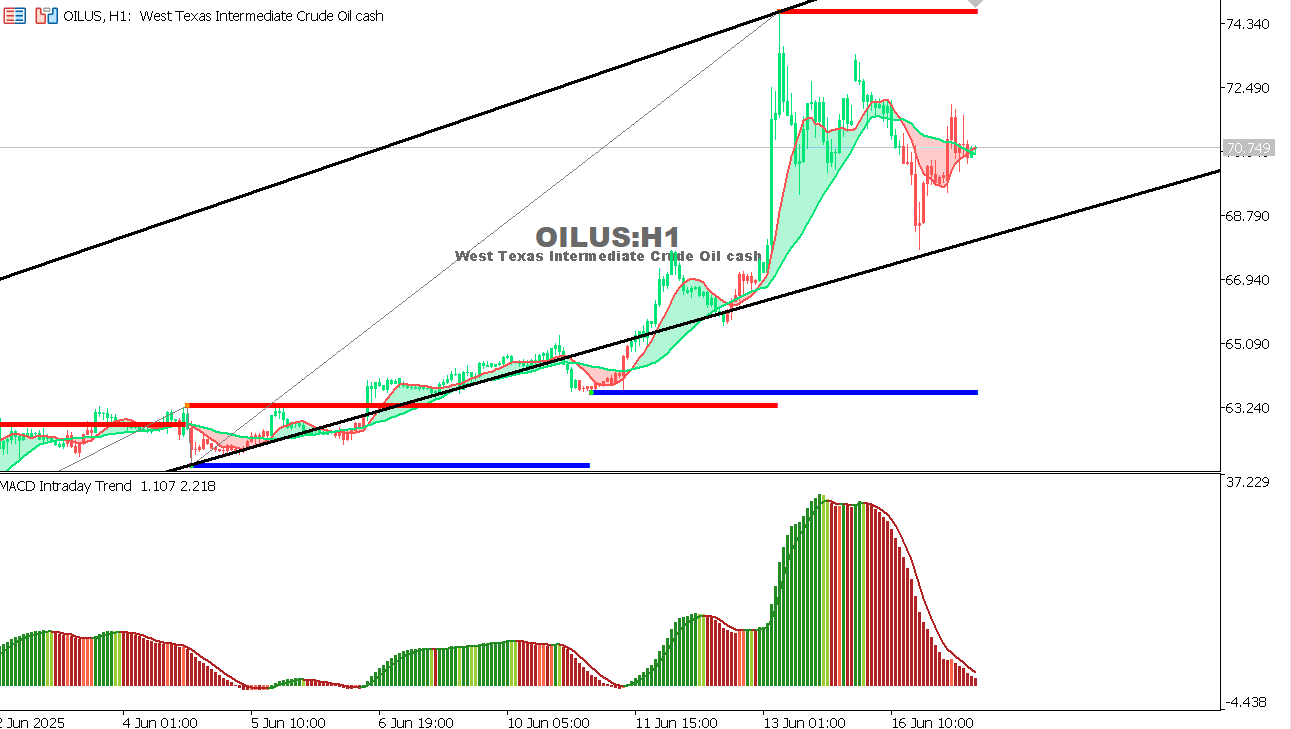
USOIL Chart on the hourtly time frameYesterday, we expected the upward trend to continue as long as the price maintained trading above 69.90, reaching the first target of 73.00. This was achieved, but the price faced strong rejection near the 74.30 area and has now rebounded to the 70.70 area.
Expectation:
|