FXEM - EMPIRE MARKETS - Company New Article
To access the website's classic version and the new accounts, please click here
Aug 07, 2025
 |
|
|
 |
||
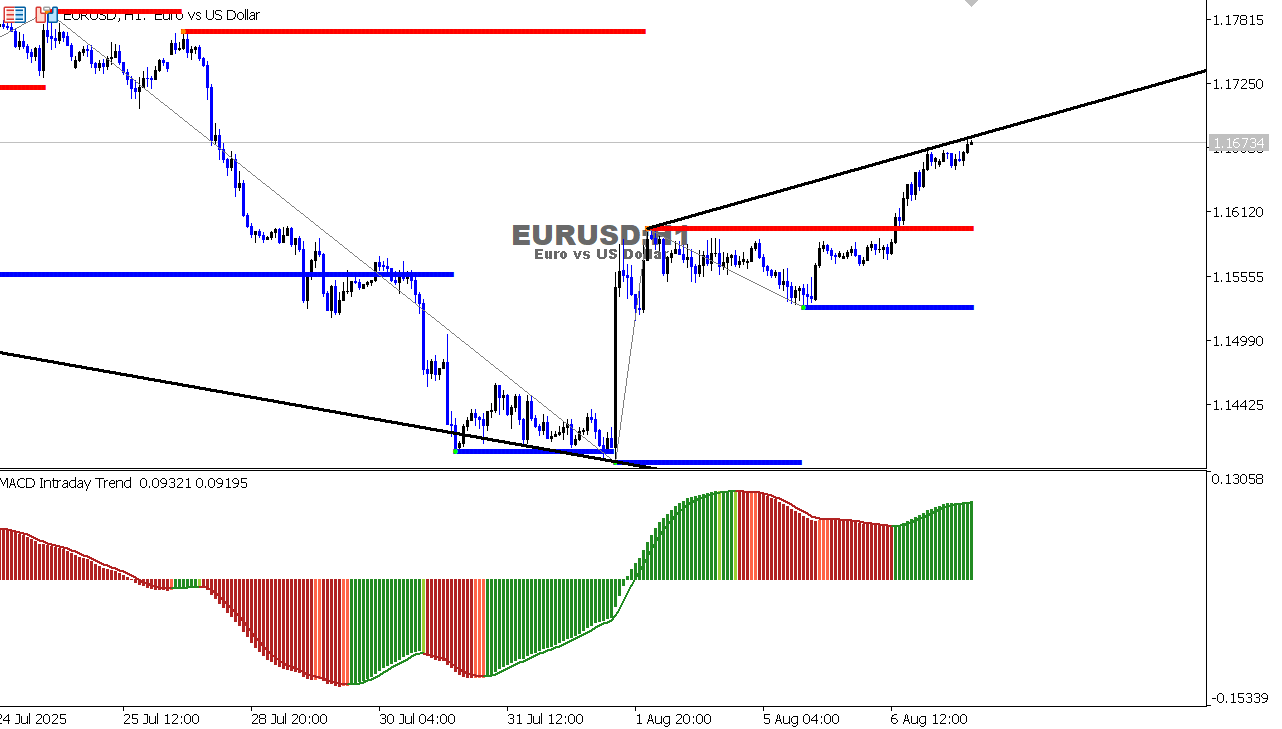
EUR/USD Chart on the hourtly time frameTrend: Bullish. Note: Price has broken out of a small ascending channel to the upside and is approaching a sloping resistance around 1.1720. MACD: Positive, supporting upward movement. Possible Scenario: Continuation towards 1.1720. Watch for price action near resistance.
|