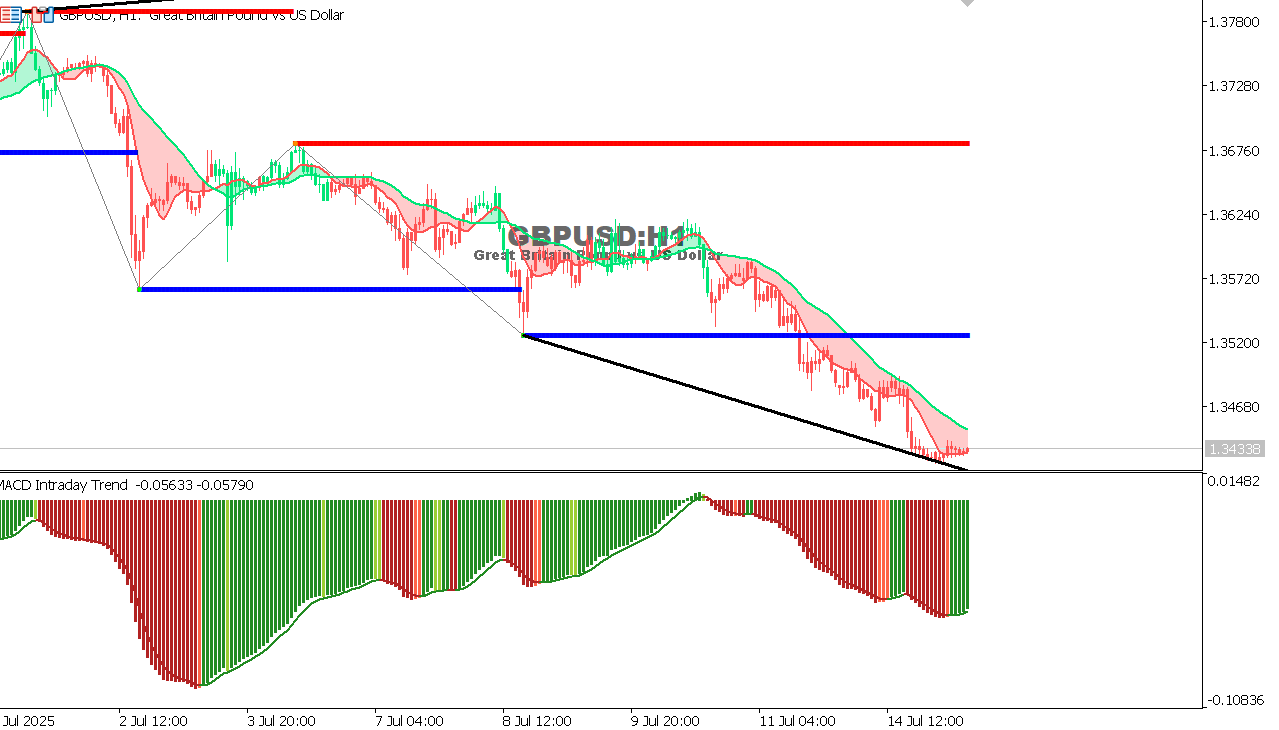
Current price: Testing sloping support (previous uptrend now broken).
Indicators: MACD remains in negative territory, but downward momentum is slowing.
Forecast:
Possible corrective bounce from 1.3430.
Any limited upside may face resistance at 1.3520 (blue line).
Continued decline is possible if the price fails to surpass the moving averages.
EUR/USD Chart on the hourtly time frame
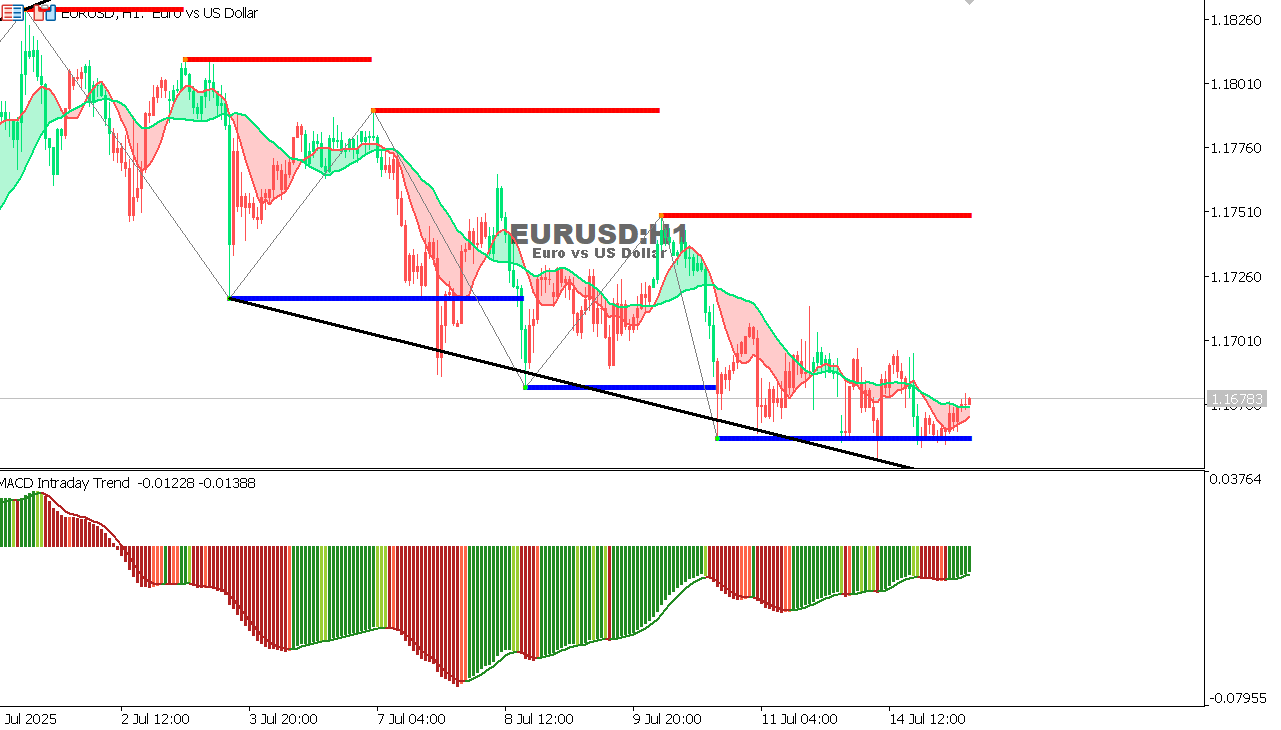
support at the blue line.
Current price: Consolidating near support, with a slight bounce.
Indicators: MACD remains negative but is gradually weakening, which may indicate a short-term bounce attempt.
Forecast:
Possible short-term bullish bounce from support (technical correction).
If the blue support is broken with a strong candle, further declines are possible.
Monitor the 1.1700 level as current resistance.
USDJPY chart on the hourly time frame
General trend: An upward correction from support near 145-146, with potential for further downside pressure.
Trading is above the 200H1 moving average near 144-145. Strong resistance is at 147.2-147.8, and support is at 145.8-145.4.
Forecast: An upward correction heading to 148–149 if the resistance is broken. If it fails and selling pressure prevails, it may return to 145 or deepen to 144–142. The key support to maintain a positive short-term trend is 145.8.
This website uses cookies to ensure you get the best experience on our website. We use cookies for proper website navigation and function and for statistical and analytical purposes. You can select the cookie categories that you would like to manage through the Cookies Settings at any time. Please configure your Cookies Settings before proceeding. To learn more, please read our Cookies Policy
We use cookies to ensure the best possible experience as a guest in our site. Please configure your cookies settings before proceeding.
Necessary
Always active
These cookies are strictly necessary to enable you to move about the website and to provide certain features you have requested. There is no need for consent for the use of such cookies.