FXEM - EMPIRE MARKETS - Company New Article

To access the website's classic version and the new accounts, please click here

Jul 15, 2025
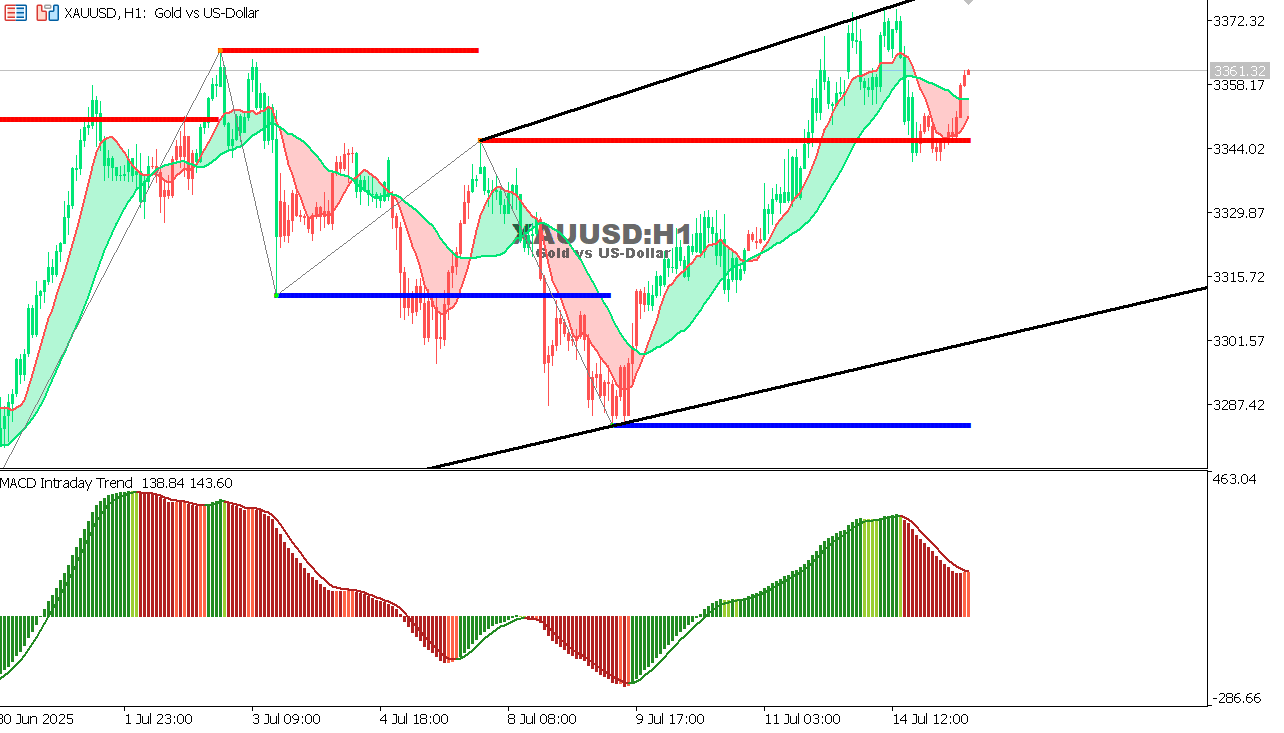
XAU/USD chart on the hourly time frame

XAU/USD chart on the hourly time frame

  • General trend: Upward within an ascending channel.
  • Current price: Rebounded strongly from previous support at 3344.
  • Indicators: MACD is positive but has begun to slow, indicating a possible correction.

Forecast:

  • Gold remains positive and may target the 3370–3380 levels.
  • In the event of a correction, the nearest support is at 3344.
  • As long as the price is above the lower trend line (black), the uptrend remains intact.

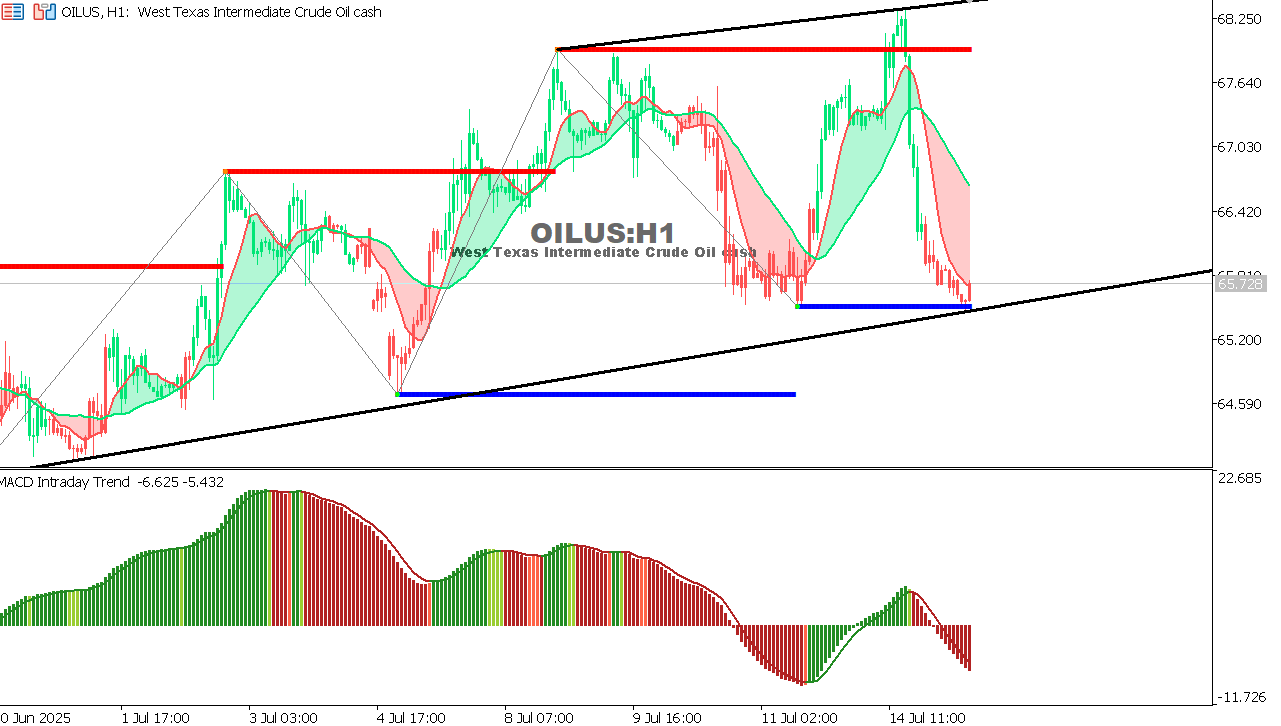
USOIL Chart on the hourtly time frame

USOIL Chart on the hourtly time frame

General trend: Medium-term bearish within a downtrend channel between 60–69.

Support is being tested in the 64–65 range, where it has seen multiple bounces. The negative MACD indicator hints at a possible temporary upward correction.

Mixed Forecasts - Goldman Sachs expects WTI to reach $63 in the second half of 2025, while the EIA raises its forecast to a mid-$66 range, pushing the $59-$66 range for the remainder of the year. However, increased OPEC+ supply adds further downside pressure.

Forecast: A short upward correction toward $68-$69 if support holds. A sharp break below $64 could push the price down toward $60-$62.

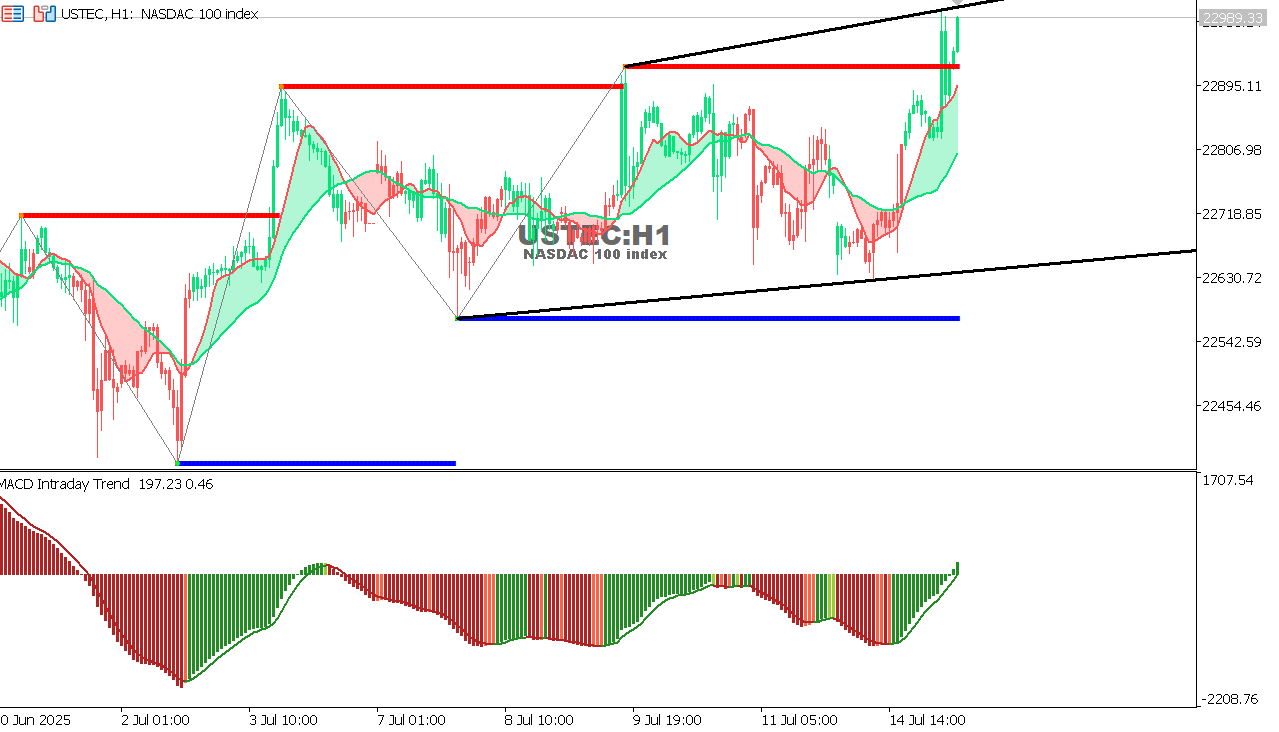
USTEC chart on the hourly time frame

USTEC chart on the hourly time frame

General trend: Bullish and strong, continuing to set record highs supported by strong performance from the technology sector, especially Nvidia.

An expected $500 billion investment injection from JPMorgan during the second half of 2025 will propel the market by an additional 5–10%. Despite trade tensions (Trump's tariffs are 30%), investor sentiment remains positive.

Forecast: A moderate rally will continue within the 23,000–24,000 range, with a possible slight correction due to geopolitical tensions or inflation data.

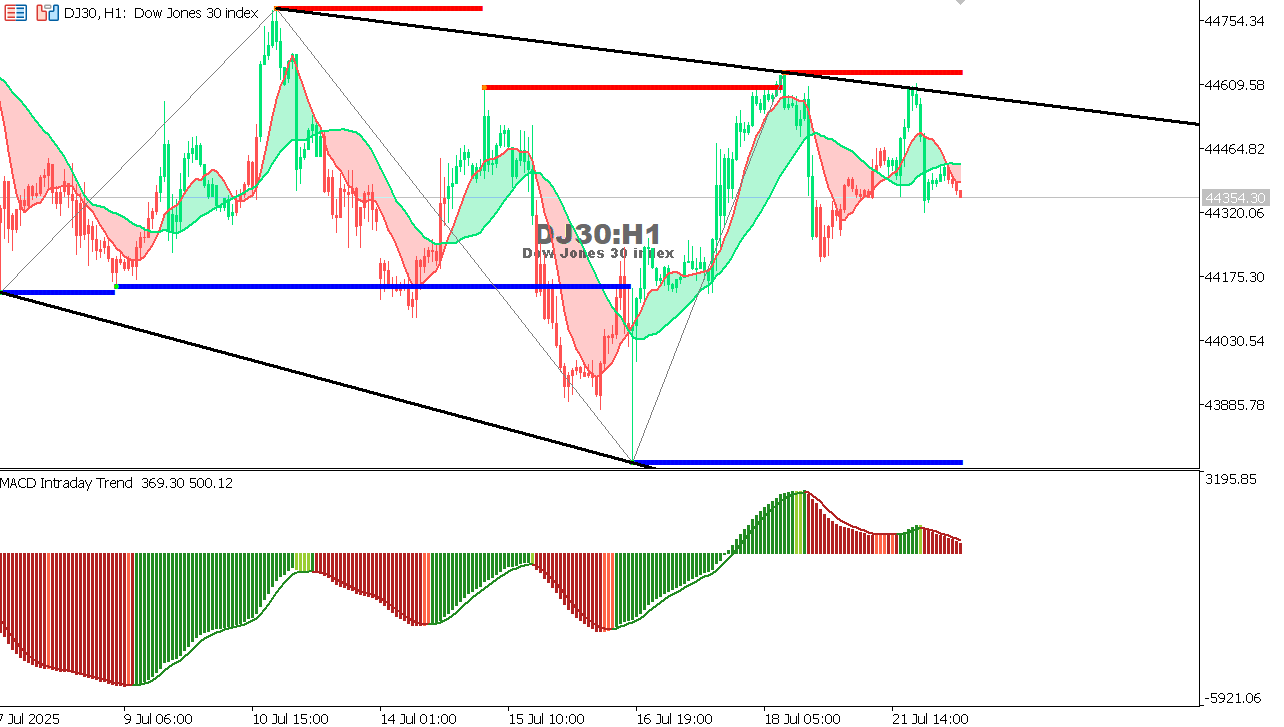
US30 chart on the hourly time frame

US30 chart on the hourly time frame

General trend: Upward; Fluctuating between 44,000 and 45,000.

News: Trade pressures have led to updates to sanctions and tariffs, leading to volatile movement in US stock futures with a relatively low close.

Forecast: Volatility likely to continue within the current range. A rise towards 45,500–46,000 if tensions ease, or a correction towards 43,500–43,000 if tariffs escalate.

- A look at yesterday's report dated July 14, 2025.


To open Live account click here 

One Trading Account | 50+ Forex Pairs | 80+ Trading Instruments
Multi-Asset Trading Platforms

Cookie Policy
This website uses cookies to ensure you get the best experience on our website. We use cookies for proper website navigation and function and for statistical and analytical purposes. You can select the cookie categories that you would like to manage through the Cookies Settings at any time. Please configure your Cookies Settings before proceeding. To learn more, please read our Cookies Policy