FXEM - EMPIRE MARKETS - Company New Article
To access the website's classic version and the new accounts, please click here
Jul 14, 2025
 |
|
|
 |
||
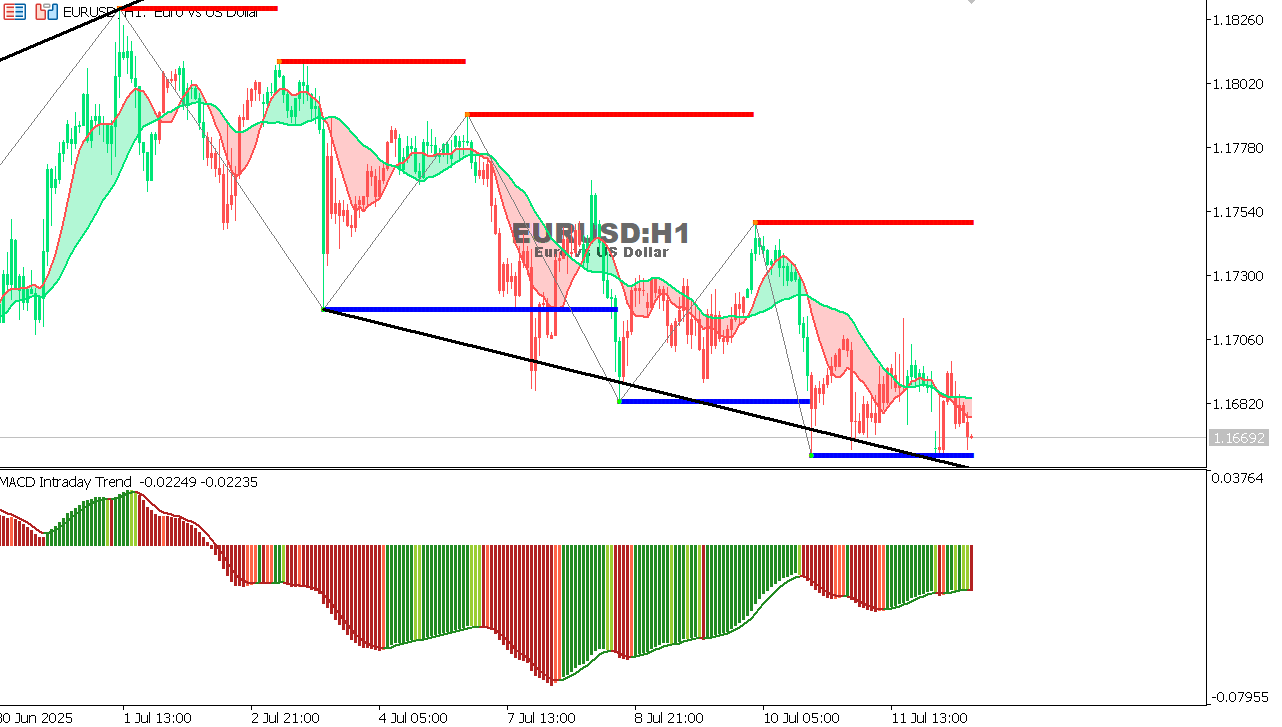
EUR/USD Chart on the hourtly time frameGeneral trend: Bearish Technical situation:
Expectation: If the current support is broken, we may see an extension of the decline towards 1.1640 and then 1.1610.
|