FXEM - EMPIRE MARKETS - Company New Article
To access the website's classic version and the new accounts, please click here
Aug 13, 2025
 |
|
|
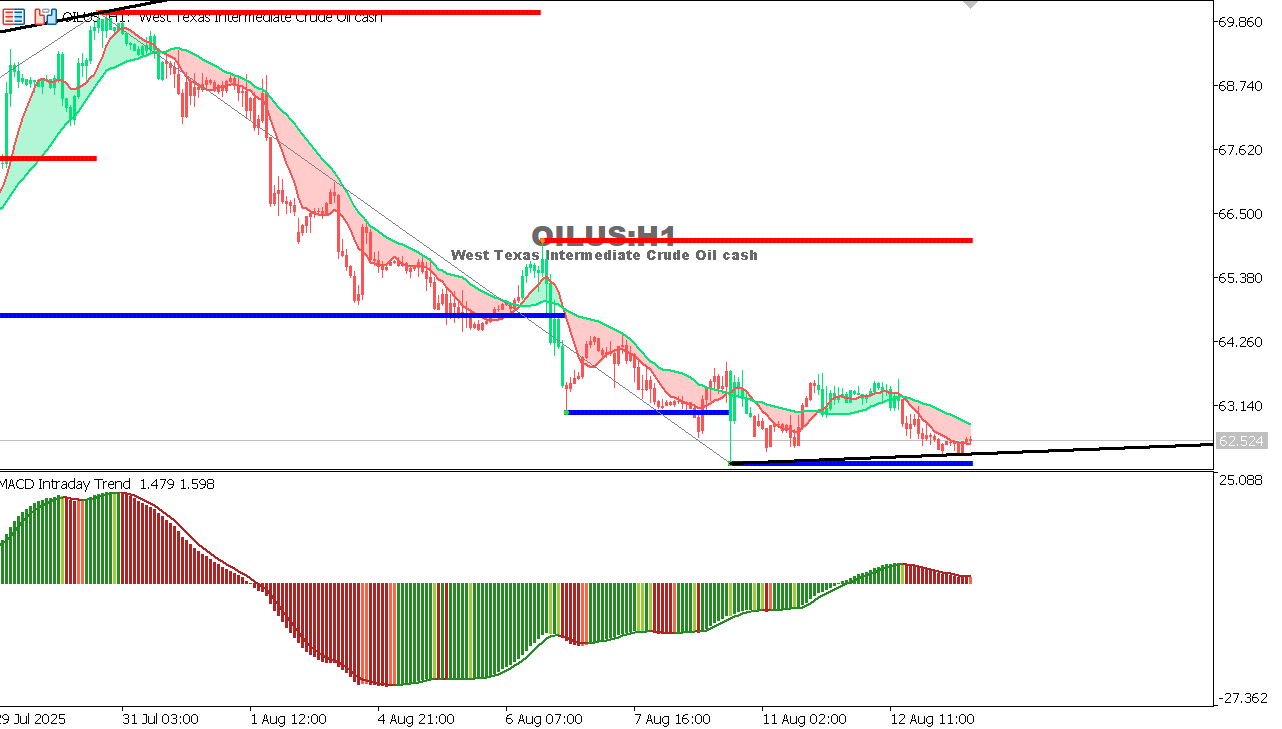 |
USOIL Chart on the hourtly time frame
Today's plan: Wait for a reversal candle above 62.50 to buy towards 64, or sell if it breaks 62 with a target of 60. |
 |
|
|
 |
|
|