FXEM - EMPIRE MARKETS - Company New Article
To access the website's classic version and the new accounts, please click here
Aug 14, 2025
 |
|
|
 |
||
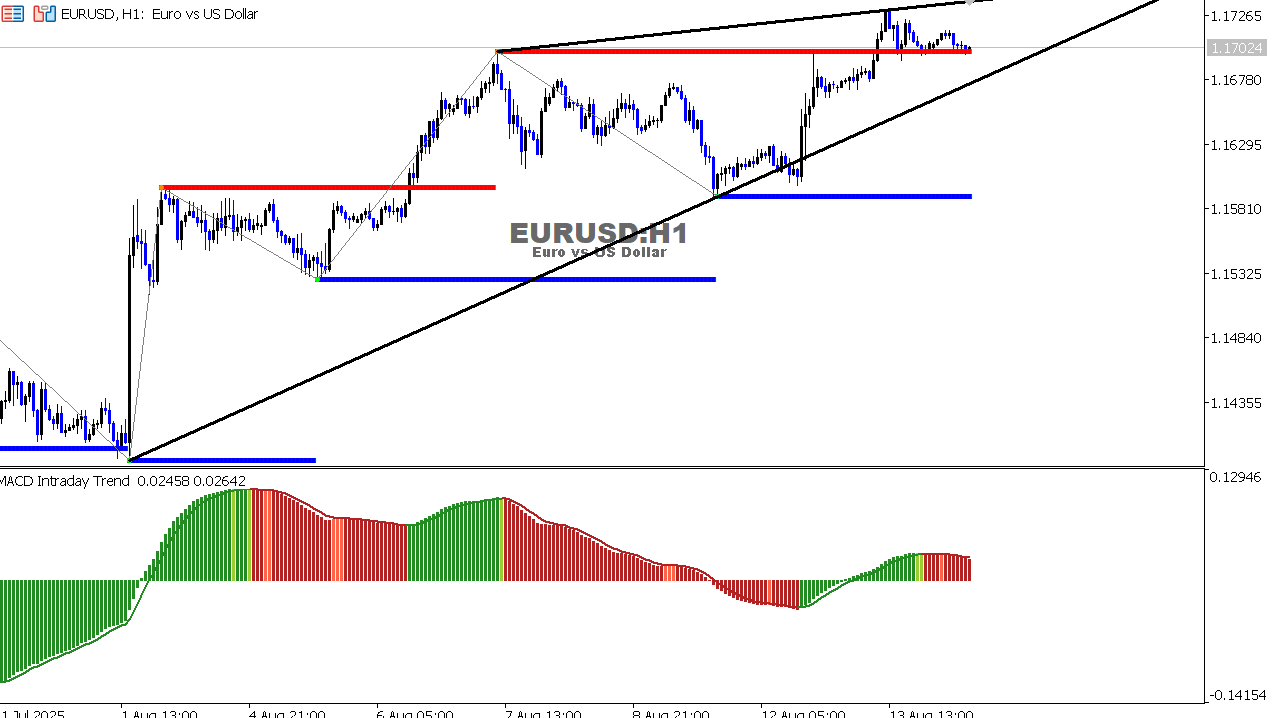
EUR/USD Chart on the hourtly time frame
Likely Scenarios:
Strategy: Wait for a confirmed breakout or breakdown.
|