FXEM - EMPIRE MARKETS - Company New Article
To access the website's classic version and the new accounts, please click here
Apr 14, 2026
Technical analysis of some commodities pairs:
Technical Analysis Report (April 14, 2026):
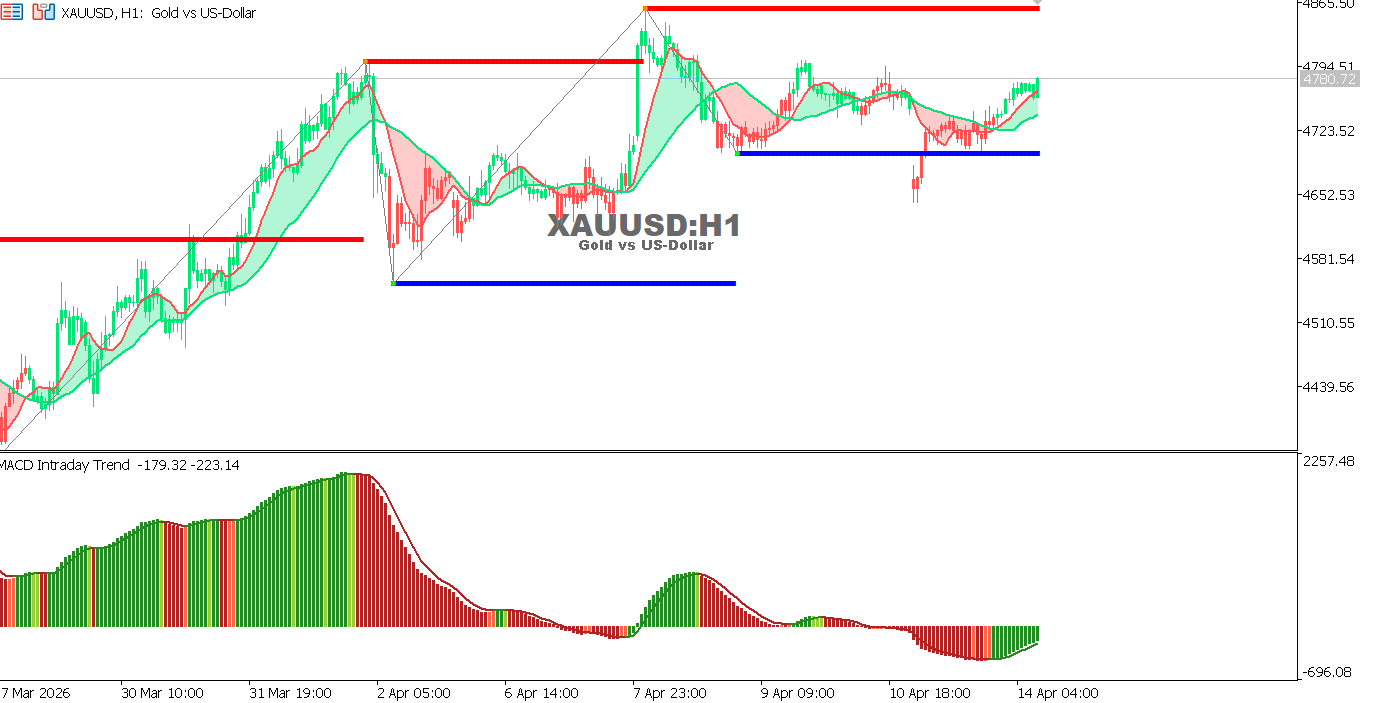
XAUUSD Hourly Chart
Gold is trading near 4780.72 after a strong recovery from support levels, attempting to break key resistance zones.
Momentum is clearly improving, as the MACD has turned positive again, supporting continued upside in the short term.
- Trend: Bullish
- Support: 4740 – 4715
- Resistance: 4790 – 4865
Outlook:
A breakout above 4790 supports further gains toward 4865, while failure may lead to sideways movement or a limited correction.
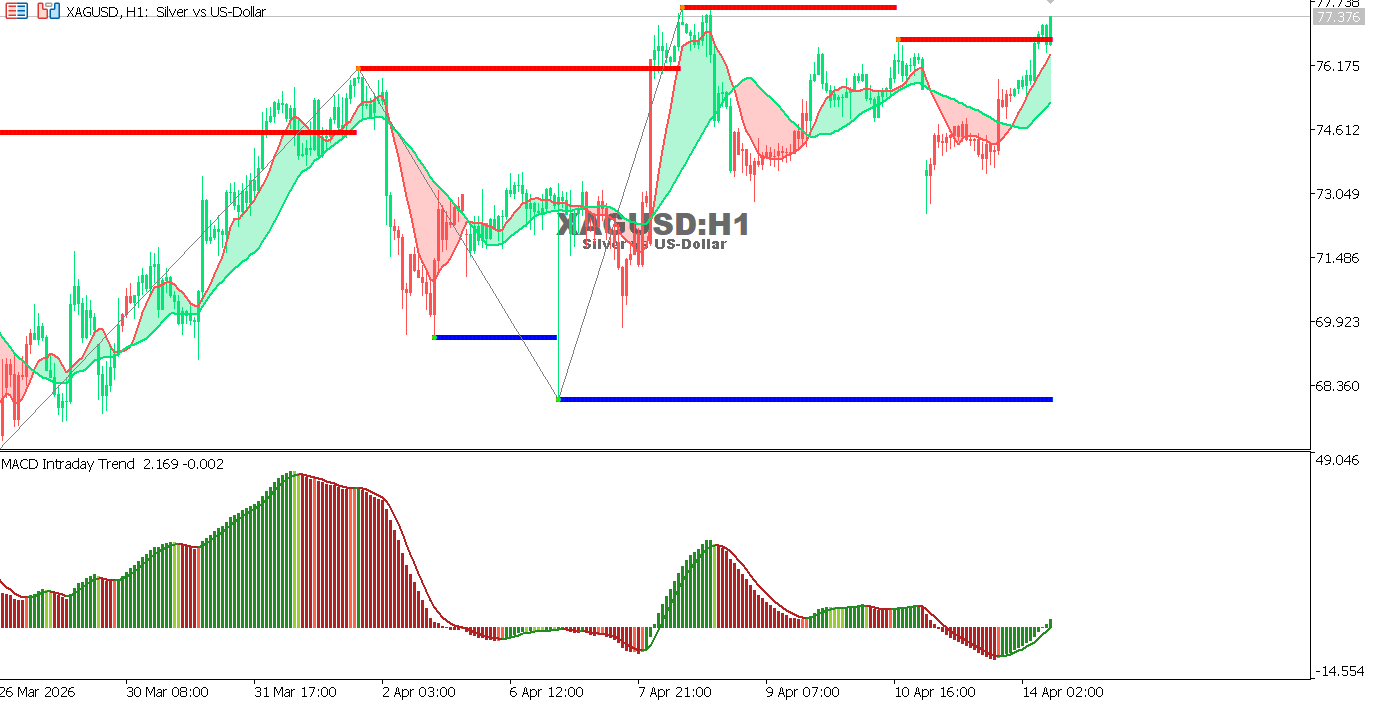
XAGUSD Hourly Chart
Silver is trading near 77.37 after a strong upward move, stabilizing above key support levels.
Momentum is slowing slightly, suggesting the possibility of a limited correction before continuing the trend.
- Trend: Bullish
- Support: 75.80 – 72.90
- Resistance: 77.70 – 79.20
Outlook:
Holding above 75.80 supports continued upside, while a break below may trigger a temporary correction.
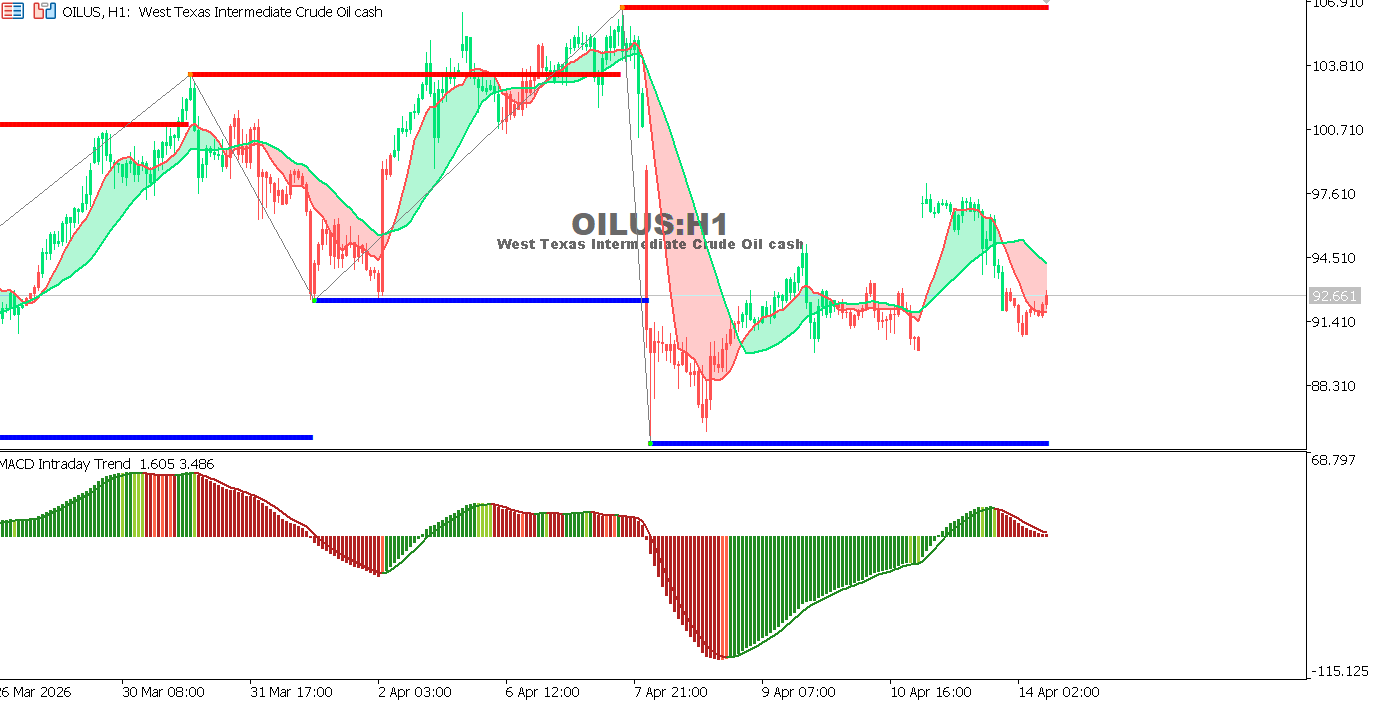
USOIL Hourly Chart
Oil is trading near 92.66 after pulling back from recent highs, attempting to stabilize above short-term support levels.
Momentum is gradually improving following a previous decline, which may support a limited rebound.
- Trend: Neutral to bullish
- Support: 91.40 – 88.30
- Resistance: 95.80 – 97.60
Outlook:
Holding above 91.40 supports recovery toward 95.80, while a break below may bring back selling pressure.
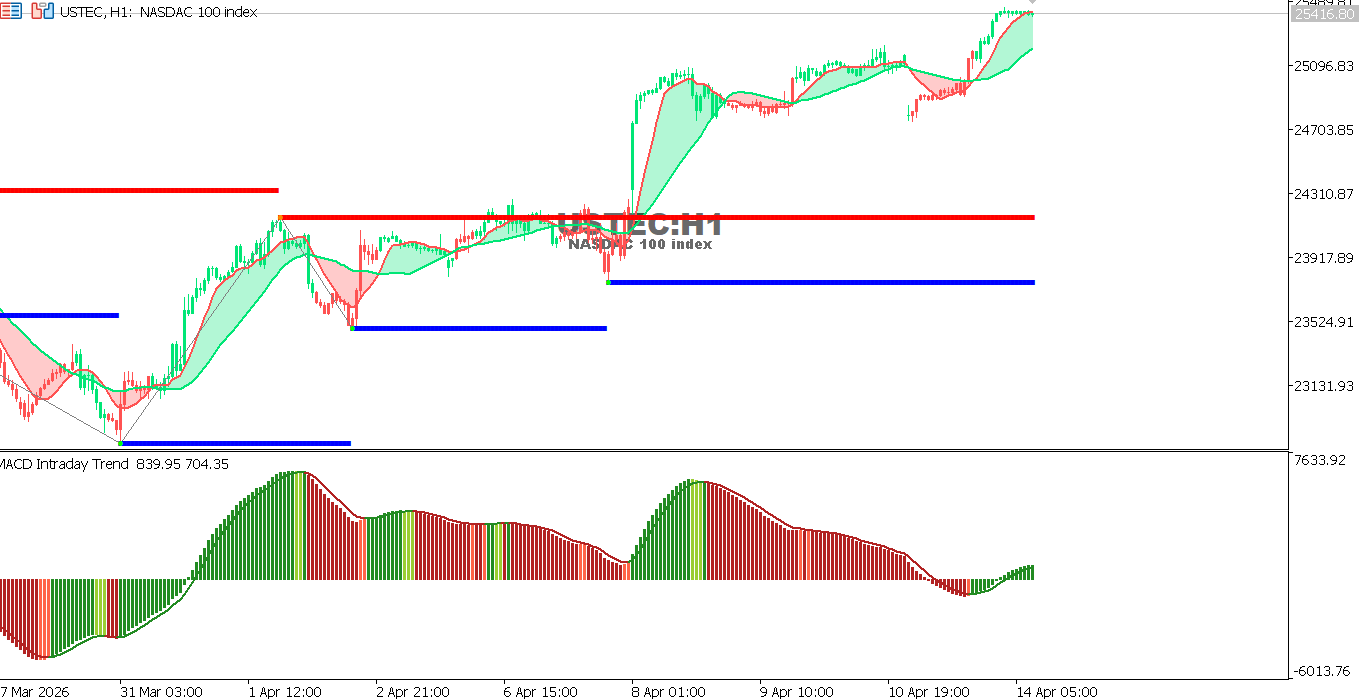
USTEC Hourly Chart
The index is trading near 25416.80 after resuming its upward move and reaching new highs.
Momentum remains clearly positive, supporting continued upside in the short term.
- Trend: Bullish
- Support: 24950 – 24530
- Resistance: 25550 – 25800
Outlook:
Holding above 24950 supports further gains, while a break below may lead to a limited correction.
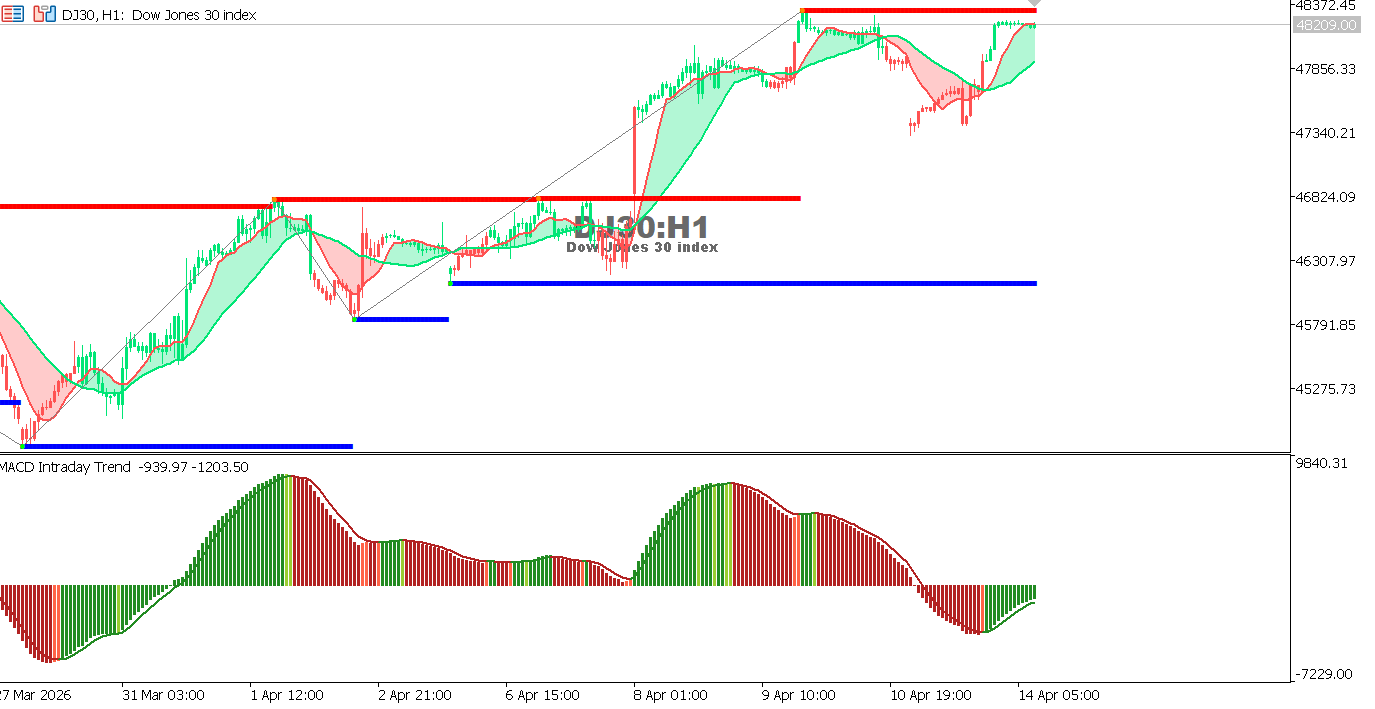
US30 Hourly Chart
The index is trading near 48209.00 after a strong rally and a breakout above previous highs, with some easing in momentum.
The MACD shows slight weakening, indicating the possibility of a limited correction.
- Trend: Bullish
- Support: 47850 – 47350
- Resistance: 48350 – 48650
Outlook:
Holding above 47850 supports the continuation of the uptrend, while a break below may trigger a limited downside correction.